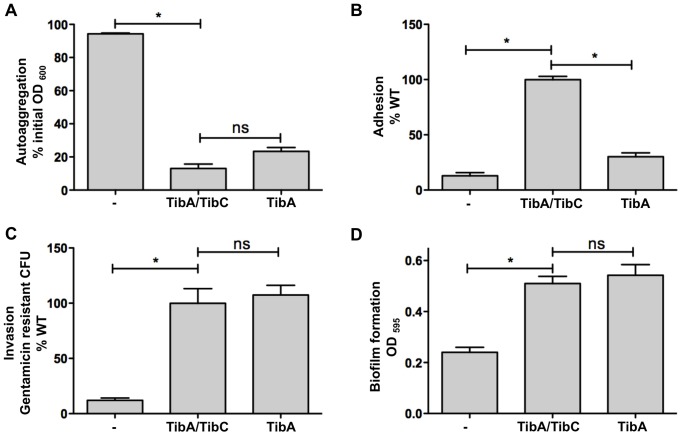
Figure 3. Effect of glycosylation on the functionality of TibA.
(A) Autoaggregation assay: E. coli C600 bearing an empty vector (-), a plasmid allowing the expression of glycosylated TibA (TibA/TibC) or unglycosylated TibA (TibA) were normalized to an OD600 of 1.5 and left standing. OD600 at the top of the culture was measured at the beginning of the assay and after 2 h. Results are shown in percentage of initial OD600. (B) Adhesion assay: Bacteria were inoculated onto monolayers of confluent Hep-2 cells. After 3 h, the adhering bacteria were recovered, plated and counted. Results represent the percentage of adhered bacteria compared to glycosylated TibA. (C) Invasion assay: After adhesion, extracellular bacteria were killed by addition of gentamicin and invaded bacteria were recovered, plated and counted. Results represent the percentage of gentamicin resistant bacteria compared to glycosylated TibA. (D) Biofilm formation assay: Biofilms were stained with crystal violet and the amount of fixed dye was determined by measuring OD595. Experiments were done three times in duplicate and ANOVA and Dunnett post-tests were used to identify significant (*; p<0.05) and non-significant (ns) differences with glycosylated TibA.

