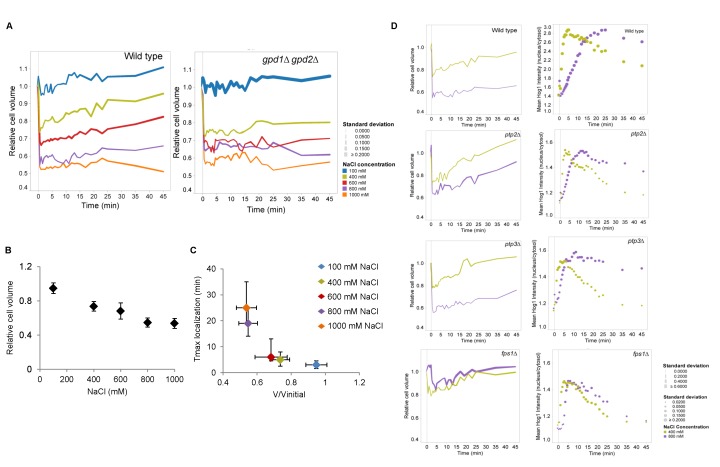
Figure 2. Hog1 nuclear accumulation correlates with cell volume recovery dynamics.
A. Relative cell volume changes of cells treated with different concentrations of NaCl in wild type and the gpd1∆ gpd2∆ mutant. Colors indicate different salt concentrations and symbol sizes show the standard deviation for each time point. Ca. 60 cells were monitored. B. Relative cell volume (untreated cells = 1.0) as a function of NaCl concentration in wild type cells. Data represent the average of about 60 cells and the error bars indicate the standard deviation between cells. Cell volume was monitored over time and for each cell the lowest volume value at the relevant salt concentration was used to calculate the average. C. The time point at which Hog1 nuclear concentration reaches its maximum as a function of relative cell volume compression. Data on the y-axis represent the average time point of maximal Hog1 nuclear localization of about 60 cells and the vertical errors bars present the variation between the time points in which cells reach their Hog1 maximum localization. Data on the x-axis represent maximal relative cell volume reduction of those cells and the horizontal bars the standard deviation between cells. D. Changes of relative cell volume (left panels) and Hog1-GFP nuclear localization (right panels) upon treatment with 400mM and 800mM NaCl in wild type, ptp2∆, ptp3∆, and fps1∆ mutants. Colors represent the different salt concentrations and symbol sizes indicate the standard deviation for each time point. Data represent about 60 cells for wild type and ca. 30 cells for each mutant.

