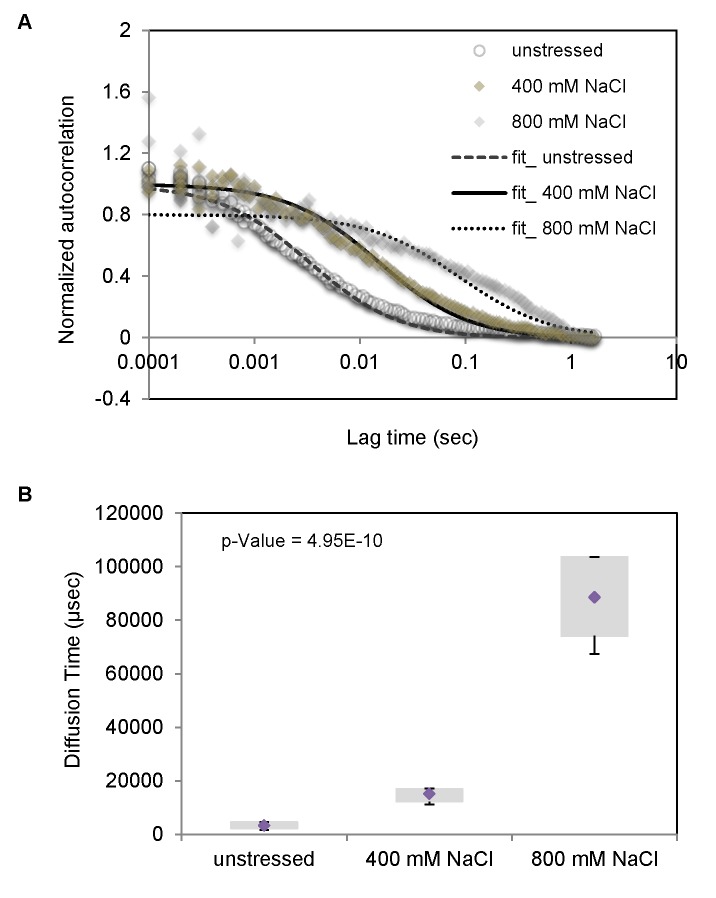
Figure 5. Free diffusion of Hog1 in the cytoplasm is strongly reduced in osmo-stressed cells.
A. The average FCS autocorrelation curves of 12 wild type Hog1-GFP, Nrd1-mCherry cells in the absence of stress and in the presence of 400mM, and 800mM NaCl media. B. Hog1-GFP diffusion time for wild type as obtained from the fits of the data represented in (A) in the absence of stress as well as in cells treated with 400mM, and 800mM NaCl, respectively. The bottom and top of the box represent the first and third quartiles. The diamond shows the mean and whiskers indicate the variability of diffusion times outside the upper and lower quartiles for the 12 cells. Measurements were performed 2.5 minutes after cells were treated with salt.

