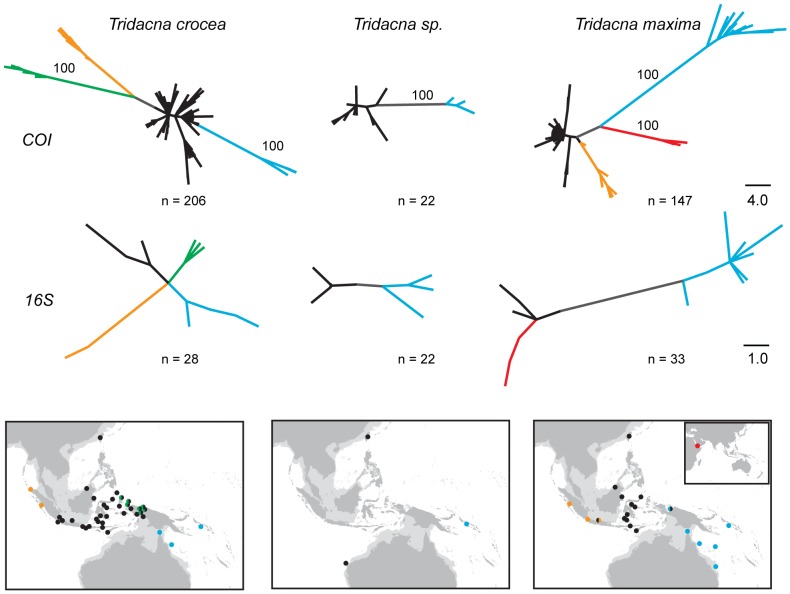
Figure 5. Unrooted parsimony trees and sampling locations for Tridacna crocea, Tridacna sp., and Tridacna maxima.
Major lineages on networks are colored and the geographic extent of each lineage is indicated on the map. Relative frequencies of each haplotype are not depicted; each haplotype is shown in equal size (see text). Dots on maps indicate sampling locations and locations with two distinct sympatric lineages are shown as bisected circles (not indicative of relative frequencies). Support for monophyly of major clades among COI trees is based on 100 percent consistency of each branch among all equally parsimonious trees (a randomly chosen tree is depicted). Among 16S trees, the single most parsimonious tree for T. sp. and T. maxima are shown, and for T. crocea both green and blue lineages were present in all six equally parsimonious trees. Colors indicate geographic locations of haplotypes and internal branches are in gray.

