
Figure 4.
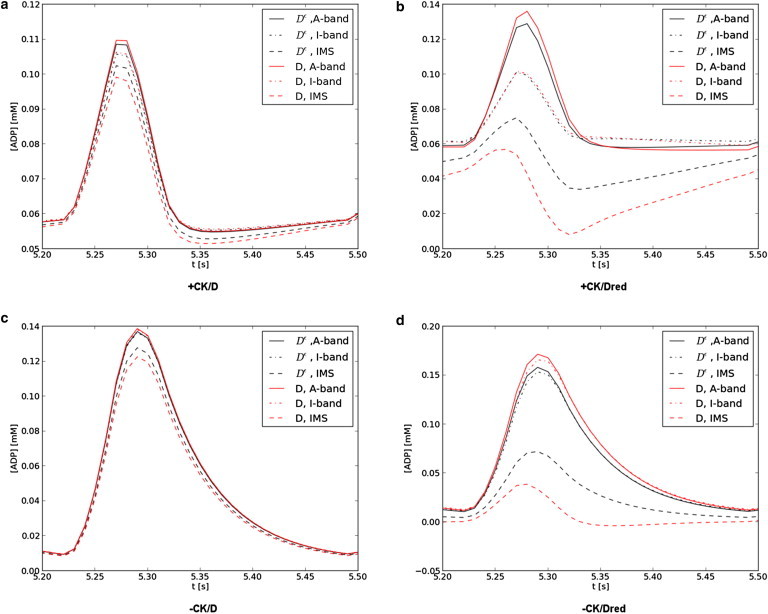
ADP concentration profiles. [ADP]at several sarcomere locations with CK (a and b) and without (c and d), and with a normal (a and c) or 10-fold reduced (b and d) diffusion constant are given. [ADP] is reported at the filament overlap region of the A-band (solid), I-band (dashed), and adjacent to the intermembrane space (dot dash) for the isotropic (black) and anisotropic (red) diffusion constants. ADP profiles are in agreement with Fig. 10 of Van Beek (37). To see this figure in color, go online.