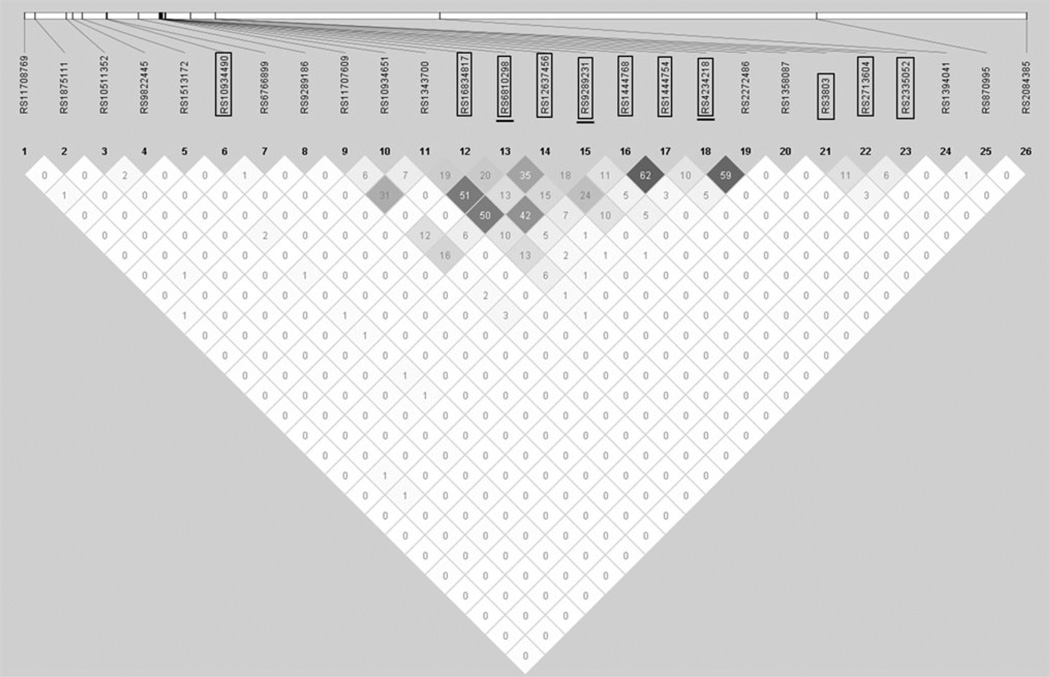
Figure 3.
Linkage disequilibrium across SNPs. Linkage disequilibrium (LD) plot of 11 SNPs from Horne et al. and 15 significant SNPs (APL-OSA P value <0.05) from across chromosome 3. Boxed SNPs are the 11 analyzed by Horne et al. (Horne BD). Underlined SNPs were also analyzed by Rudcock et al. (2011). The plot shows the pairwise r2 with darker cells having a higher r2 than lighter cells

