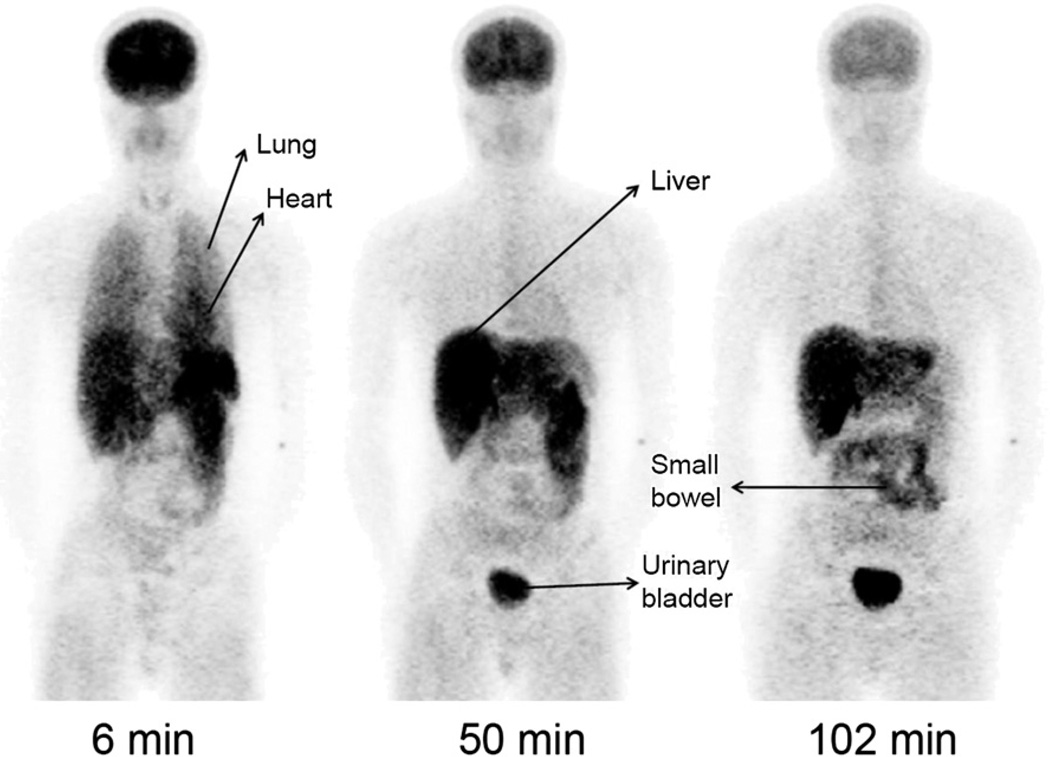
FIGURE 5.
Whole-body images of healthy 22-y-old man show distribution of radioactivity at about 6, 50, and 102 min after injection of 480 MBq of 11C-NOP-1A. In addition to high uptake in brain, image at 6 min shows high uptake in lungs and heart. Images at 50 and 102 min show excretion of radioactivity via liver, small bowel, and urinary bladder. These images were created by summing all coronal slices at each time point. Pixel values were decay-corrected to time of injection and displayed with same gray scale.

