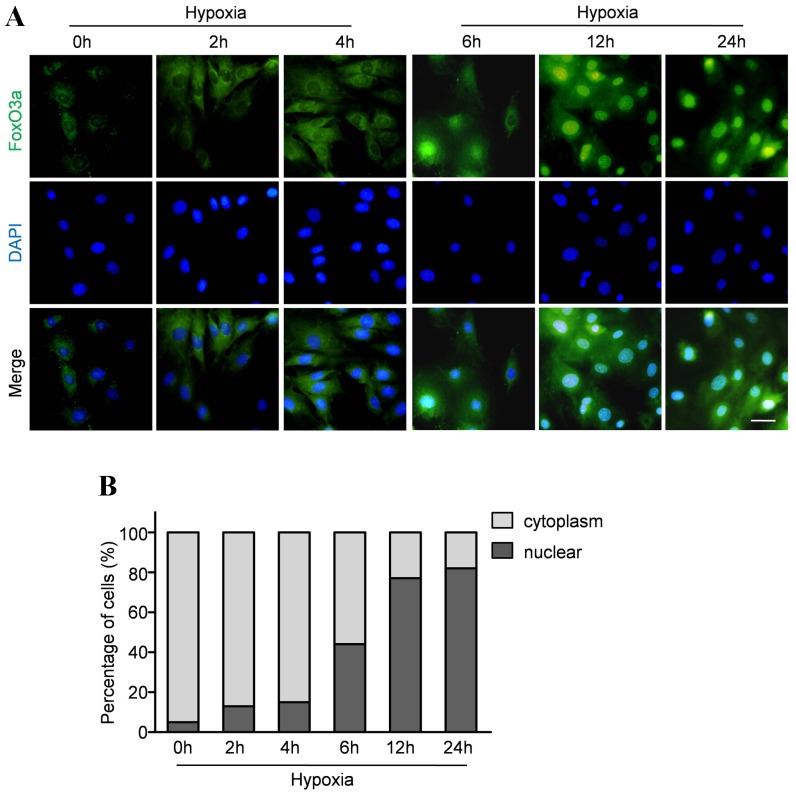
Figure 4. Hypoxia promoted FoxO3a nuclear location.
A: Representative immunofluorescence staining for subcellular localization of FoxO3a (green fluorescent) in CMECs under hypoxia condition for the indicated time points. (Scale bars: 20 µm) B: Quantification of FoxO3 nuclear or cytoplasmic localization in CMECs (n = 5).

