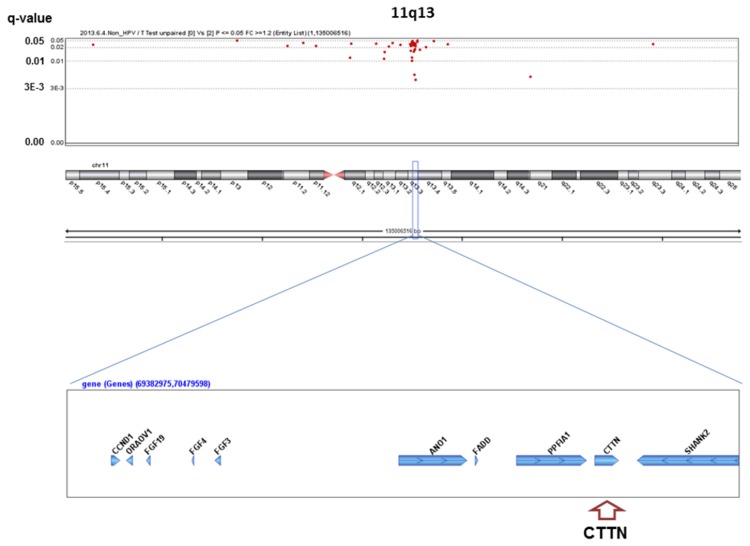
Figure 6. Significant SCNAs at 11q13 associated with heavy alcohol consumption.
Significant q-values (<0.05) (y-axis) are plotted across the chromosome (x-axis). An oncogene or oncosuppressor gene associated with development of HNSCCs in previous studies is indicated in parentheses in each peak region. X and Y chromosomes were excluded for analysis, because alcohol drinkers and smokers were predominantly men.

