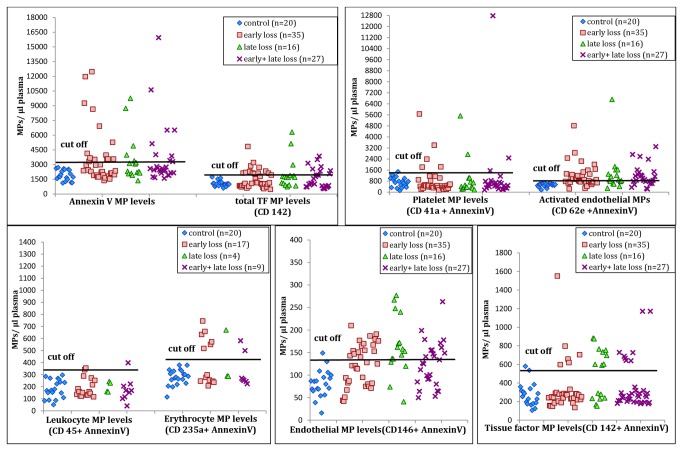
Figure 3. Cell derived microparticle levels in women suffering from ≥ 3 recurrent pregnancy loss when compared to controls.
Scatter plots of MP levels of different cell types in different groups of patients along with controls are shown in the 5 graphs. Levels >2 SD from the mean of control women are considered as cut-offs to have increased MP levels.

