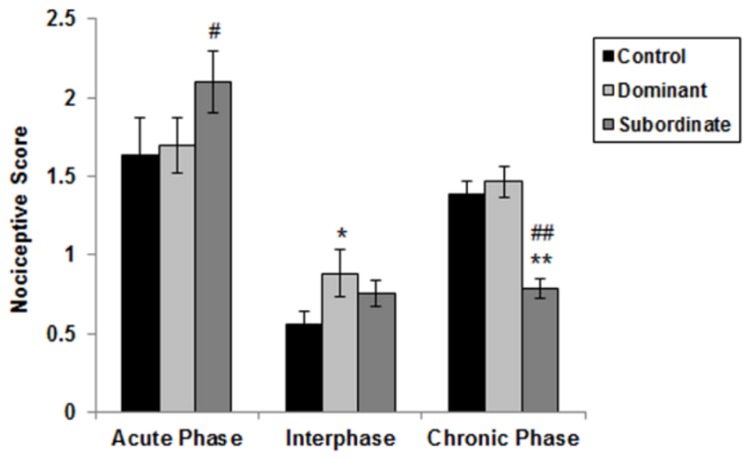
Figure 3. Effect of social dominant/subordinate social status in the model of formalin-induced pain.
Cumulated pain scores during the acute phase (cumulated pain scores from 0 to 6 min), interphase (cumulated pain scores from 7 to 14 min), and late phase (cumulated pain scores from 15 to 60 min). Symbols/bars represent mean ± SEM pain scores per group. (Controls: n=8, Dominants and subordinates: n=9).
* p < 0.05, ** p < 0.001:: significant difference between dominant/subordinate animals and controls.
# p < 0.05, ## p < 0.001: significant difference between dominant and subordinate animals.

