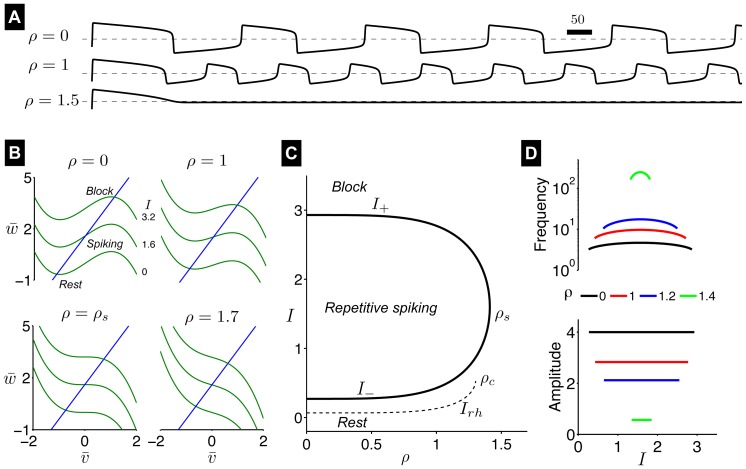
Figure 2. Repetitive firing in the AFHN model.
(A) Simulated  traces for
  and different values for
  . The dashed lines indicate
  . (B) Phase-plane portrait for variable
  and
and  . In each panel, the
  -nullcline (green) is shown for 3 values of
  . The
. The  -nullcline (blue) is independent of
  and
and  . (C)
. (C)  -
- parameter space, denoting regions of rest, repetitive firing, and block. The limit cycle lower and upper limits (
 , Eq. 6 ) and rheobase (
 , Eq. 9 ) as functions of
  . (D) Frequency and amplitude of action potentials, as functions of
  and
and  .
.

