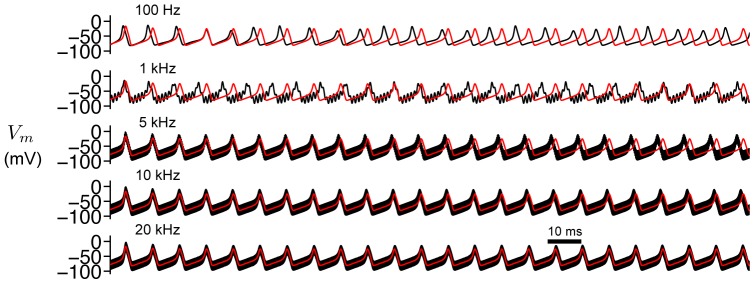
Figure 5. Validation of the AHH model.

Simulated  traces from the HH (black) and AHH (red) models for varying HF stimulus frequency
  . Parameters:
  rad/s (where
  is the frequency identified in each panel),
  = 30
= 30  ,
, 
 .
.

Simulated  traces from the HH (black) and AHH (red) models for varying HF stimulus frequency
  . Parameters:
  rad/s (where
  is the frequency identified in each panel),
  = 30
= 30  ,
, 
 .
.