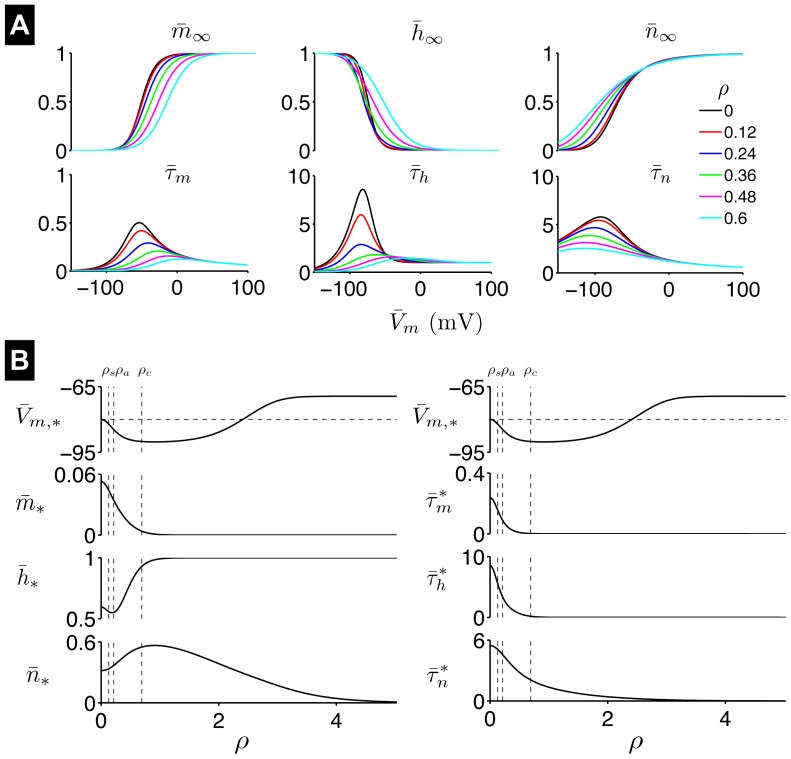
Figure 8. Steady-state of the AHH model.
(A) Steady-state gating variables  ,
,  ,
,  and time constants
  ,
,  ,
,  as functions of
  in the AHH neuron model for different
  values. (B) Steady-state values for the transmembrane potential
  and the gating variables (left), and gating variable time constants at
  (right), as functions of
  . Vertical dashed lines indicate
  ,
,  , and
, and  (see text for description). In the top panels, the horizontal dashed line indicates
  mV for
  . Time constants in units of ms, and
  in units of
  .
.

