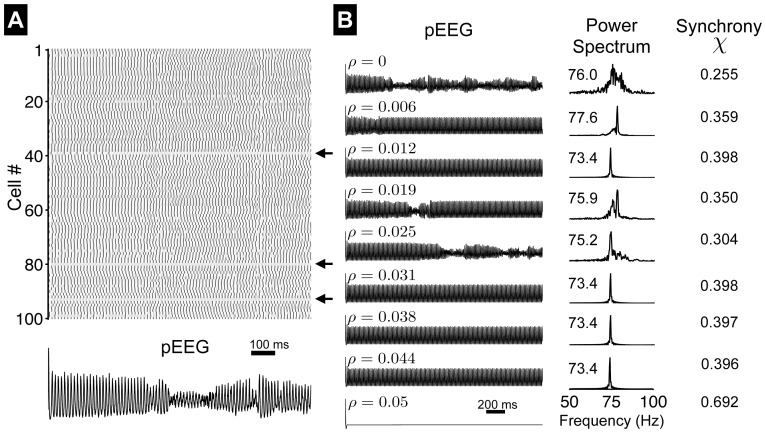
Figure 9. Electrical activity in a network of AHH model neurons.
(A) Rastergram of action potentials and the pseudo-electroencephalogram (pEEG). Arrows indicated quiescent neurons. Parameters:  ,
,  . (B) pEEG (left, Eq. 32 ), the corresponding power spectrum (middle, value indicates the average neuron firing rate), and synchrony measure
  (right, Eq. 33 ), as functions of
  .
.  in units of
  .
.

