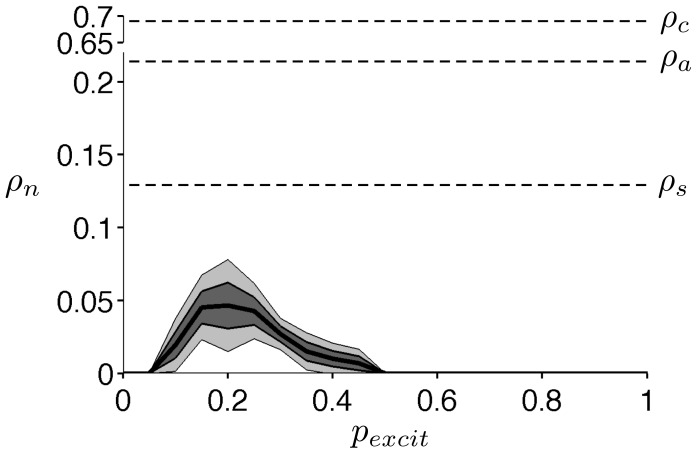
Figure 10. HF stimulation of a network of AHH model neurons.
The critical value  for repetitive activity in a AHH model neural network, as a function of the probability of excitatory synaptic connections
  . The mean
  (thick black) over
  simulations,
  1 (solid black) and 2 (thin black) SEM (standard error of the mean, standard deviation of
  ) are shown. Single cell critical values of
  (
( and
and  ) are identified (see text for description).
  in units of
  .
.

