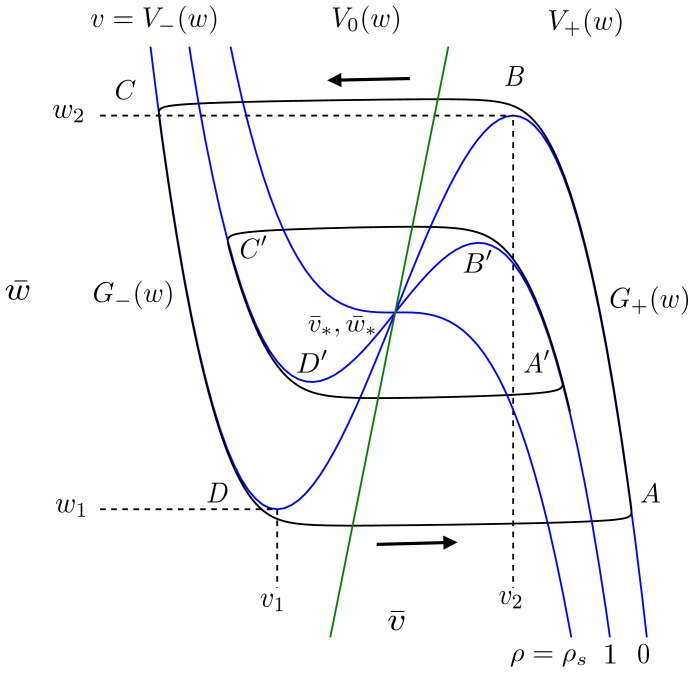
Figure 11. Period of a stable limit cycle in the AFHN model.
For  , the period
  of the stable limit cycle is approximately the sum of the time required to traverse the two stable branches of the
  -nullcline,
  , denoted by the points
  and
and  , respectively. As
  increases, the amplitude and period of the stable limit cycle, indicated by the second set of points labeled
  , both decrease. See text for description of other variables in figure. Parameters:
  .
.

