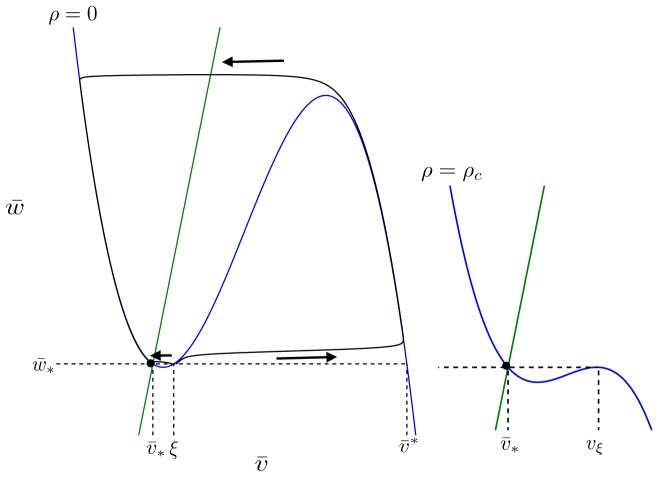
Figure 12. Sub- and super-threshold brief stimuli in the AFHN model.
(Left) For  ,
,  indicates the threshold for evoking an action potential. Two trajectories starting near
  are identified by arrows: (1, left arrow) when the initial condition
  ,
,  returns quickly to the resting potential
  ; (2, right arrow) when
  , an action potential is evoked: the system follows a counterclockwise trajectory, quickly approaching the
  -nullcline, following the right stable branch until reaching the right knee, quickly reaching the left stable branch, and then returning to rest. (Right) When
  ,
,  , the critical value above which an action potential cannot be evoked by a brief perturbation from the steady-state.

