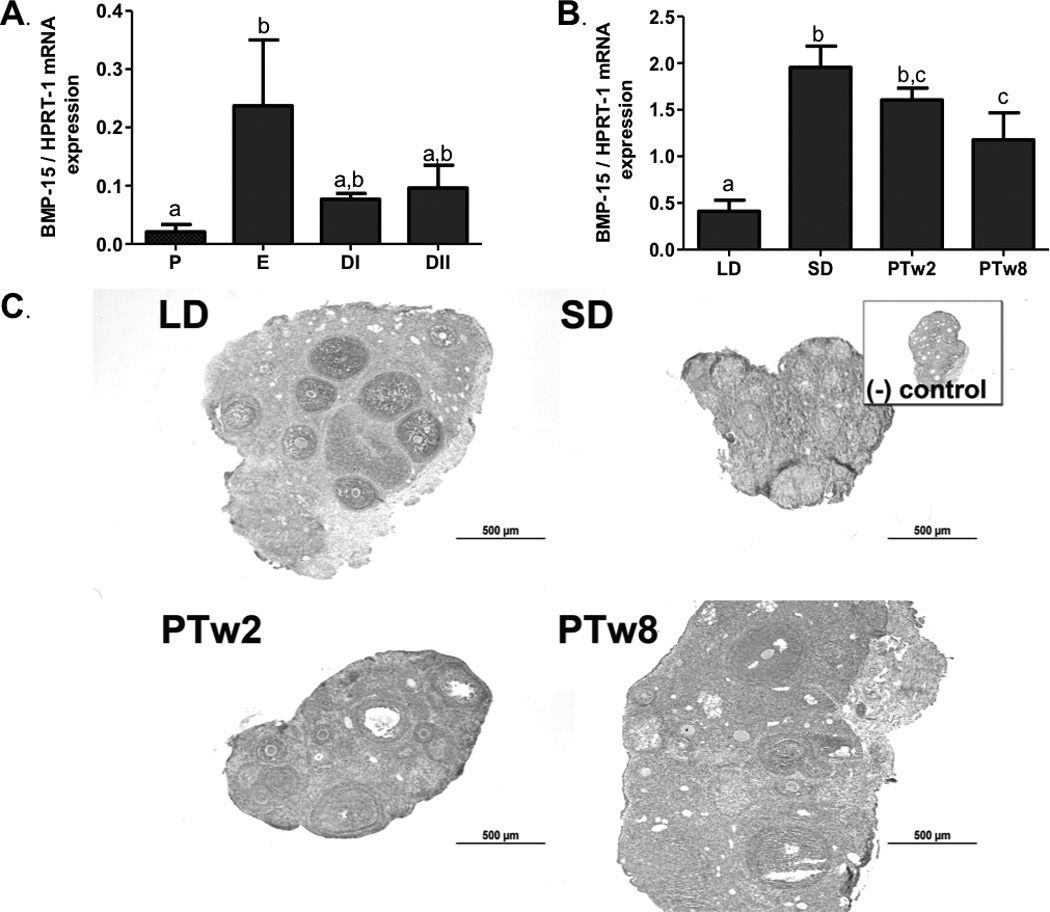
Figure 4. Ovarian BMP-15.

4a) Ovarian BMP-15 mRNA levels during the estrus cycle. P (proestrus), E (estrus), DI (diestrus I) and DII (diestrus II). 4b) Ovarian BMP-15 mRNA levels during photoperiod induced regression/recrudescence. LD= long day exposure/control, SD= inhibitory short day exposure, PTw2= post transfer from SD to LD for 2 weeks, PTw8= post transfer from SD to LD for 8 weeks. 4c) BMP-15 immunostaining during photoperiod induced regression /recrudescence. Representative immunostaining histographs of ovarian sections from each photoperiod group are shown. Inset depicts negative control processed without primary antibody. All graphical results are presented as mean ± SEM, and groups with different letters are significantly different (p<0.05).
