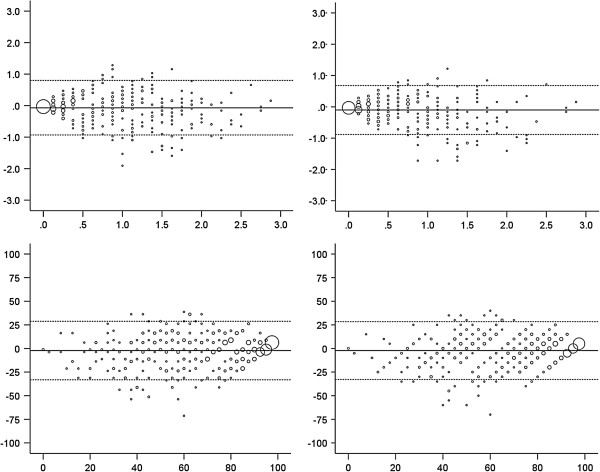
Figure 2.
Bland-Altman plots for agreement between observed and predicted HAQ-SDI (top left), HAQ-ADI (top right) and PF-10 scores (bottom left: predicted from HAQ-SDI, bottom right: predicted from HAQ-ADI). The y-axes represent the difference between observed and predicted scores. The x-axes represent the mean of observed and predicted scores. The horizontal solid lines represent the mean difference between both scores. The dashed lines represent the 95% limits of agreement.

