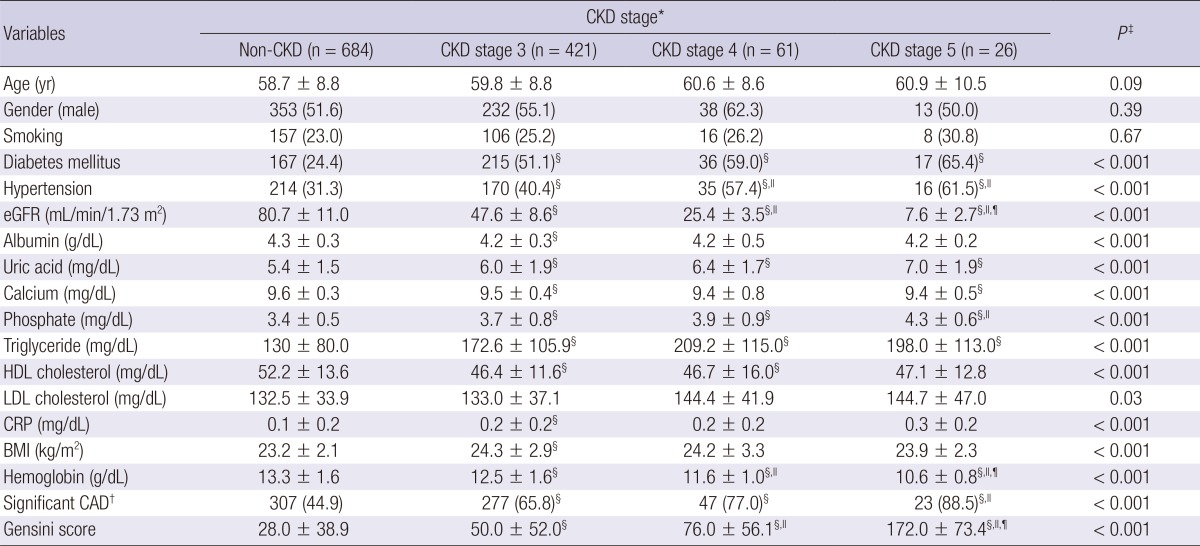
Table 1.
Baseline characteristics of study population by CKD stage

Data are presented as mean ± SD, or number (%). *CKD stage groups were categorized as Non-CKD (eGFR ≥ 60 mL/min/1.73 m2), CKD stage 3 (30 ≤ eGFR < 60 mL/min/1.73 m2), CKD stage 4 (15 ≤ eGFR < 30 mL/min/1.73 m2), and CKD stage 5 (eGFR < 15 mL/min/1.73 m2); †Significant CAD was defined as a stenosis of 50% or greater in at least one of the main coronary arteries; ‡P represents difference across the CKD group; §P < 0.05 vs Non-CKD; ∥P < 0.05 vs CKD stage 3; ¶P < 0.05 vs CKD stage 4. BMI, body mass index; CAD, coronary artery disease; CKD, chronic kidney disease; CRP, C-reactive protein; eGFR, estimated glomerular filtration rate; HDL, high density lipoprotein; LDL, low density lipoprotein.
