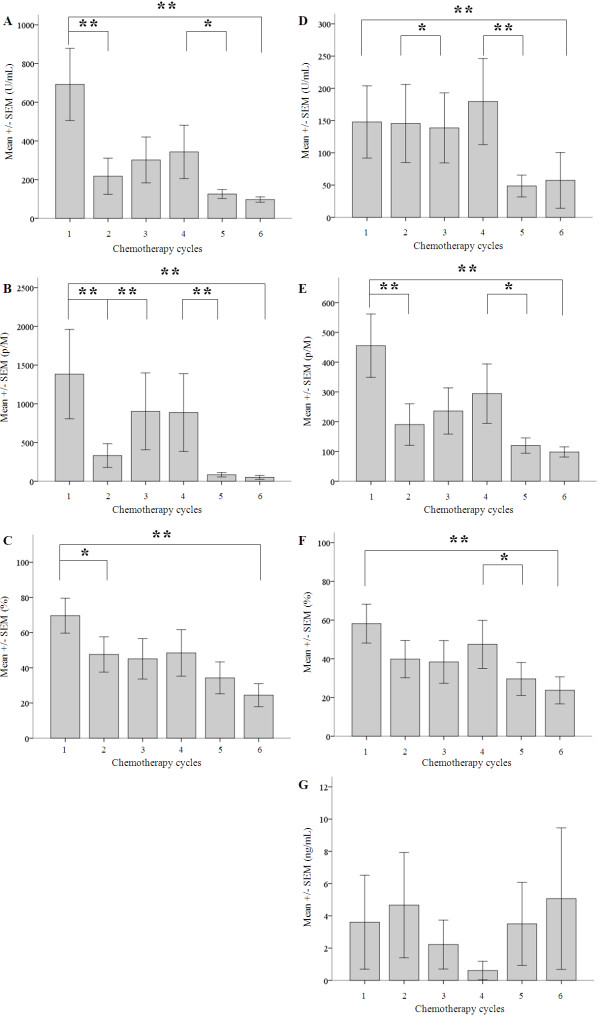
Figure 2.
Mean levels of serum biomarkers (CA-125, HE4 and 14-3-3 zeta protein) measured with ELISA and ECLIA methods, and the ROMA index values. Average values of CA-125 (U/mL) +/− SEM determined by ECLIA (A) and by ELISA (D) are shown according to the chemotherapy cycles (consistently on each x-axis from 1 to 6). Mean concentrations of HE4 (p/M), measured by ECLIA (B) and by ELISA (E) are also shown. Furthermore average values determined by ELISA (G) of 14-3-3 zeta protein (ng/ml) are depicted. Based on the above-mentioned data, we calculated the postmenopausal ROMA index values (%) for ECLIA (C) and for ELISA (F) techniques. We represent the mean levels of 14-3-3 zeta protein (ng/mL) for each of the treatment days. Wilcoxon signed-rank test analysis was performed for each diagram, and statistical significance represented with asterisk (*) was set at p < 0.05, and (**) when p < 0.01.

