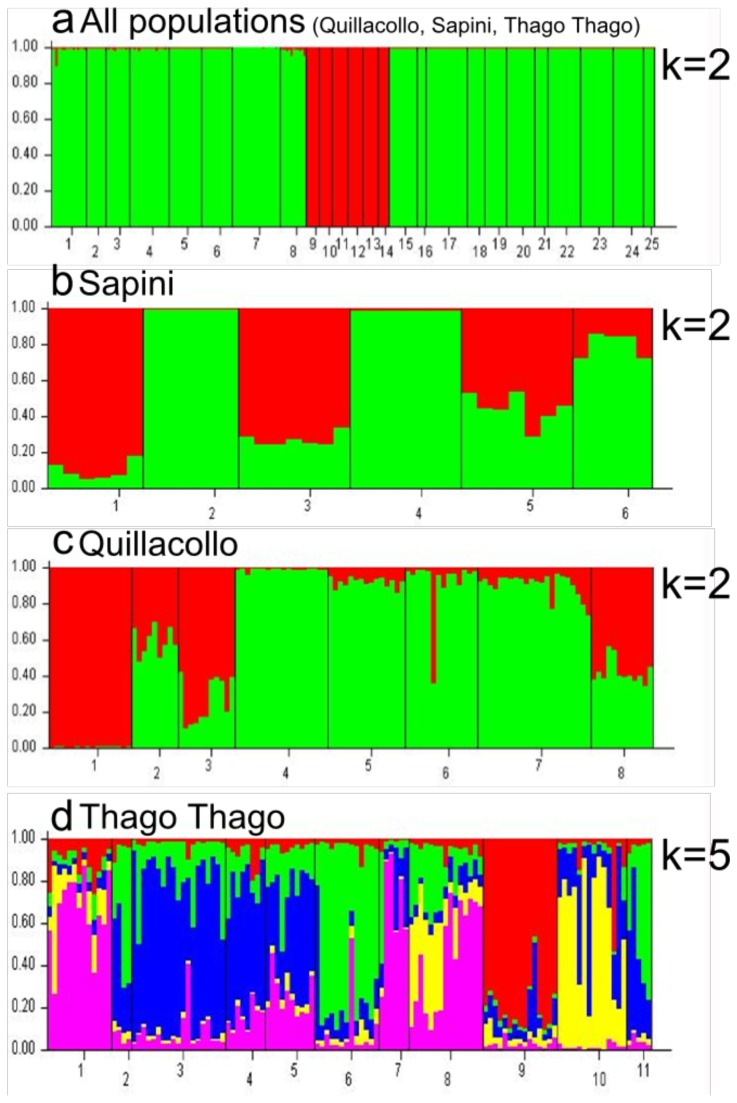
Figure 3. Plots of ancestry estimates of T. infestans individuals using STRUCTURE.
software. a – Plot of the individuals belonging to the 25 study populations, one to four intra-peridomestic populations from Quillacollo, five to eight wild populations from Quillacollo, nine and ten intra-peridomestic populations from Sapini, 11 to 14 wild populations from Sapini, 15 to 22 intra-peridomestic populations from Thago Thago, 23 to 25 wild populations from Thago Thago. b - Plot of the individuals belonging to the six populations in Sapini (one and two intra-peridomestic, three to six wild). c - Plot of the individuals belonging to the eight populations in Quillacollo (one to four intra-peridomestic, five to eight wild). d - Plot of the individuals belonging to the 11 populations in Thago Thago (one to eight intra-peridomestic, nine to 11 wild). Each individual in the data set is represented in the plots by a single vertical line, which is partitioned into different colored segments representing the individual membership estimates in each of the inferred clusters (k).

