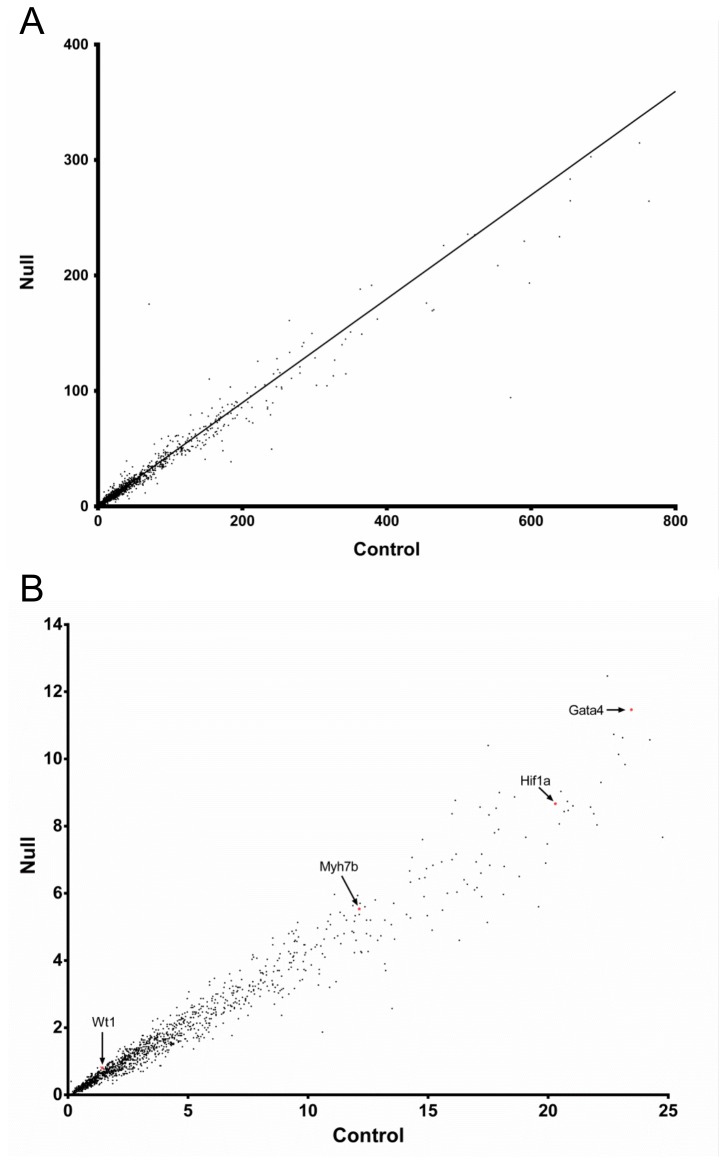
Figure 3. Scatter plot of expression level measured by RPKM: control vs.
Hltf knockout.
Panel A, each point is the mean of three replicate RPKM values for an individual gene in control heart plotted against values of the corresponding gene in Hltf null heart. The black line indicates the linear regression. R2 = 0.9818, correlation coefficient. Panel B, genes with statistically significant expression (each dot is the mean of three replicate RPKM values, differential expression >1.1 fold, and P < 0.05) in control vs. null heart samples. Genes with specific importance to this study [Gata4, Myh7b, Wt1, Hif-1a] are labeled with a red dot and a black arrow.

