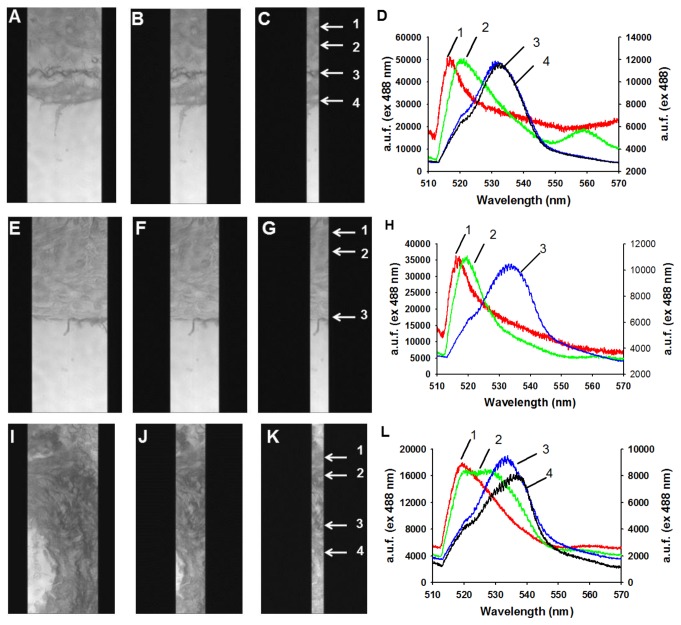
Figure 7. Spectral imaging microscopy of intrinsic fluorescence of control (A-D) and Hltf null (E-L) hearts.
Heart sections stained with picrosirius red were imaged using 488 excitation (mercury lamp) and a halogen lamp to obtain zero order spectra of regions exhibiting both elastin and collagen. Cells were imaged using a 60x oil objective (N.A. 1.4) and a 500 ms exposure. Images A, E, and I were obtained using a 3 μm slit width on the spectrograph. For images B, F and J, the slit width was closed to 1 μm. For images C, G and K the slit width was closed to 0.25 μm. This ensured the highest spatial resolution from a discrete area. Notice in A-C the highly ordered structure of wavy collagen is apparent (arrows 3 and 4). The areas corresponding to elastin were obtained from regions of interest (ROI) at arrows 1 and 2. The corresponding first order spectra at 0.4 nm resolution (D) shows the ROI labeled as 1 and 2 correspond to elastin with peaks at 515 and 520 nm; whereas collagen (arrows 3 and 4) shows an emission shoulder at 533 nm. Data were normalized since the intensity for spectra 1 and 2 were lower for elastin (14,000 arbitrary units of fluorescence, a.u.f.) than spectra 3 and 4 for collagen (a.u.f. 60,000). Images E-G and I-K with their corresponding spectra in H and L, respectively, are from null hearts. In E-G, the collagen is very thin and less structured than in controls (A-C). As shown in H, the emission spectra for collagen (a.u.f. 40,000) and elastin are similar to controls. Significant heterogeneity in collagen and elastin structure was also observed in null hearts (I-K). As shown in L, some cases of significant displacement in collagen structure were observed at 540 nm, along with a broader shoulder on elastin at 520-530 nm.

