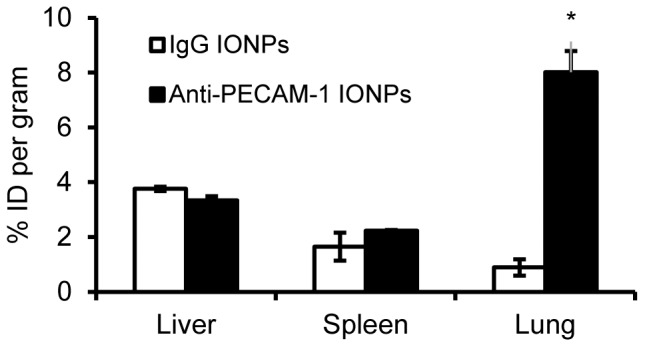
Figure 7. Biodistribution of IgG IONPs and anti-PECAM-1 IONPs in rats.

The liver, spleen and lung levels of 125I labeled anti-PECAM-1 IONPs measured 10 min after intra-arterial infusion in rats, expressed as the percentage of injected dose (%ID, 10 mg/kg). * Significantly different compared to IgG IONPs. (N = 3, mean ± SD)
