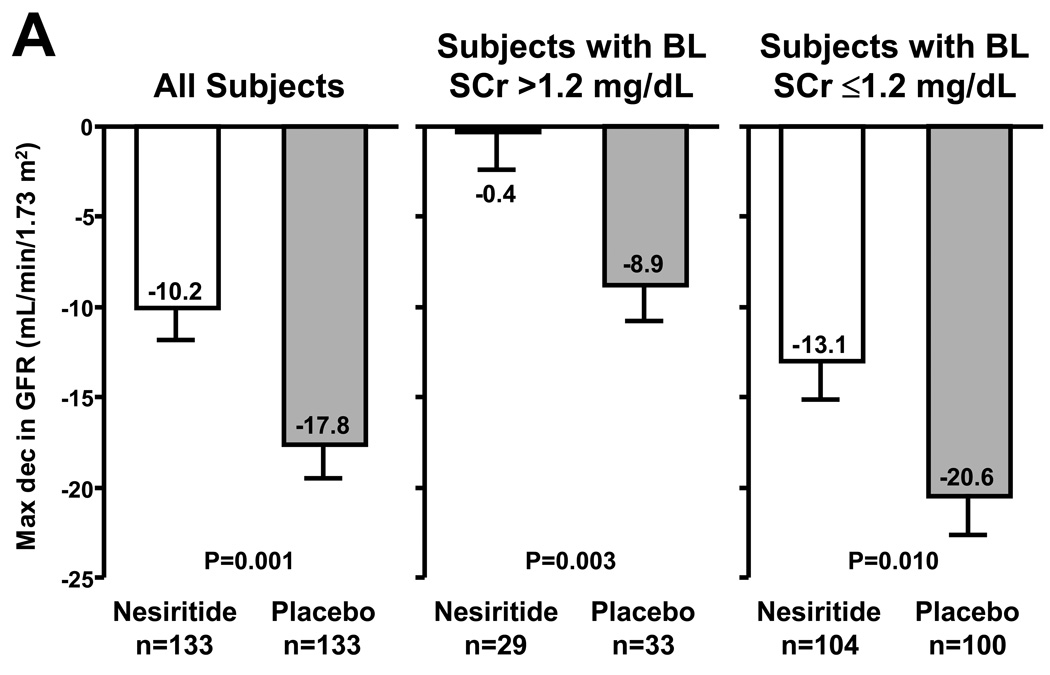
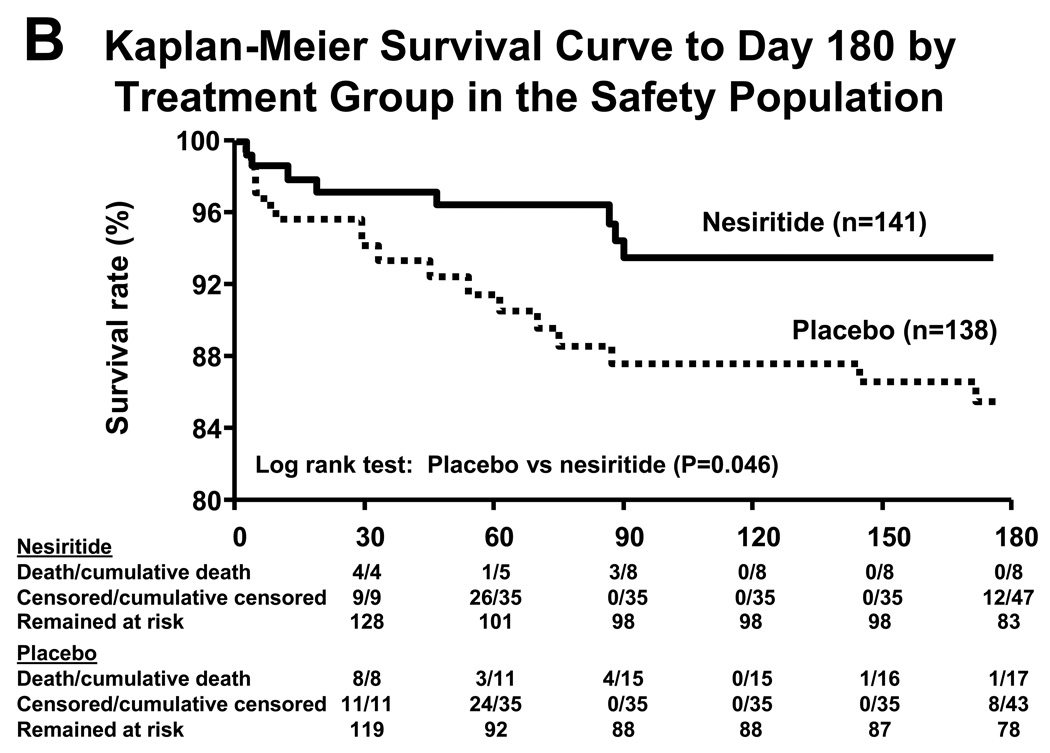
Figure 3.
Adjusted mean maximum decrease in glomerular filtration rate (GFR) from baseline through hospital discharge or by study day 14, whichever came first, using an analysis of covariance model. Lines above the bars indicate standard error of the mean (A). Kaplan-Meier survival curve to day 180 by treatment group in the ‘safety population’, which is a subset of the total study population added during the study to assess long-term safety (B). Taken from Mentzer et al. (2007); reprinted with permission from Elsevier.


