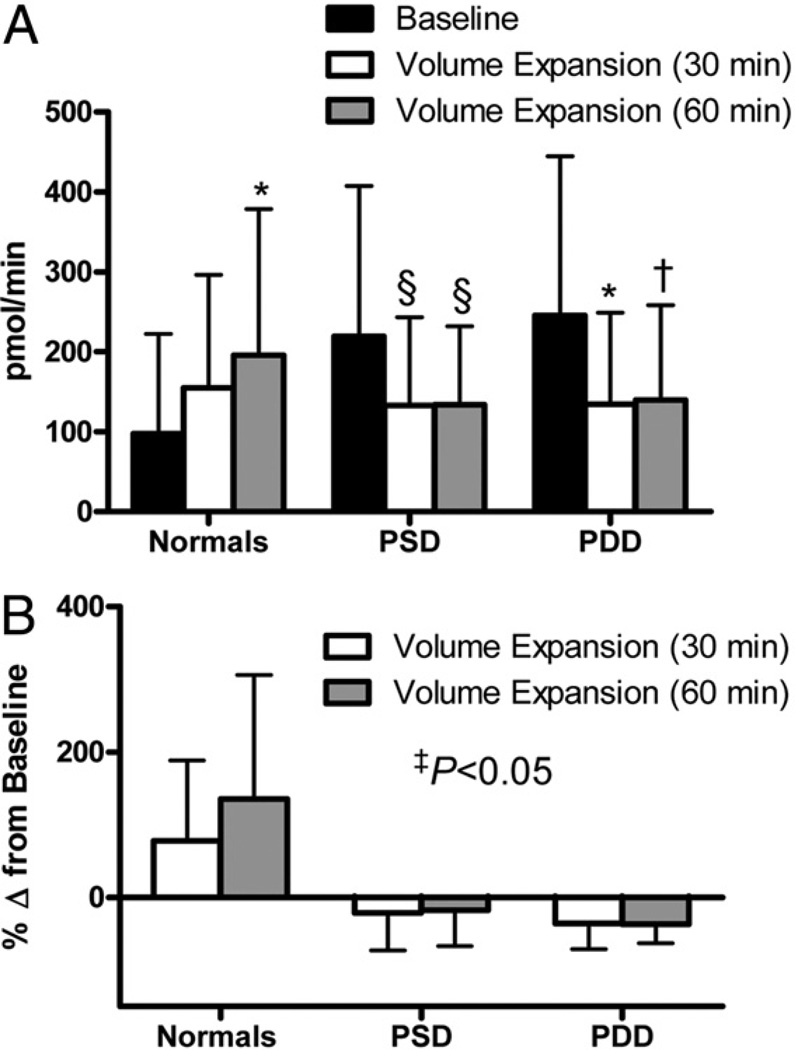
Figure 2. Urinary cGMP Excretion After Volume Expansion.
Urinary cyclic guanosine monophosphate (cGMP) excretion (A) and change in urinary cGMP excretion from baseline (B) in normal control subjects (normals), PSD subjects, and PDD subjects at baseline (black bars), 30 min after volume expansion (white bars), and 60 min after VE (gray bars). *p < 0.05, †p = 0.06, §p = 0.08 versus baseline as measured by t test using a Bonferroni correction for multiple comparisons. ‡The p value represents comparison of change from baseline to VE between groups as measured by 1-way analysis of variance. Abbreviations as in Figure 1.

