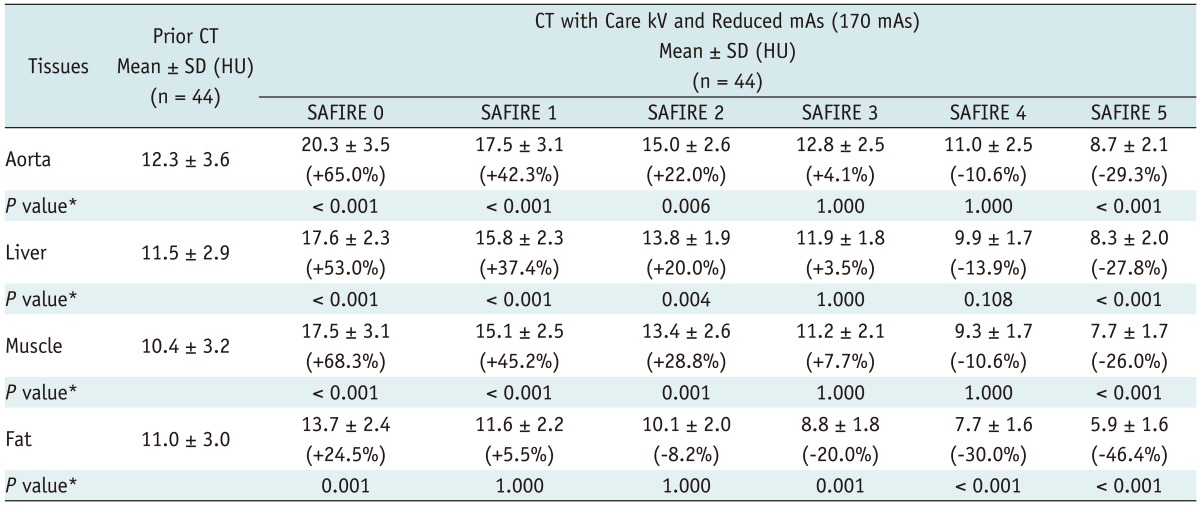
Table 3.
Organ Noise of Four Different Tissues at Different SAFIRE Strengths versus Previous CT Scan

Note.- Organ noise was obtained by taking SD of ROI measurement of CT attenuation in each tissue/organ. *P values result from comparing images reconstructed with each SAFIRE strength and prior CT images reconstructed with FBP. Numbers in parentheses indicate average image noise change between prior CT and CT reconstructed with each SAFIRE strength. CT = computed tomography, SAFIRE = sinogram-affirmed iterative reconstruction, HU = Hounsfield Unit, FBP = filtered back projection, ROI = region of interest, SD = standard deviation
