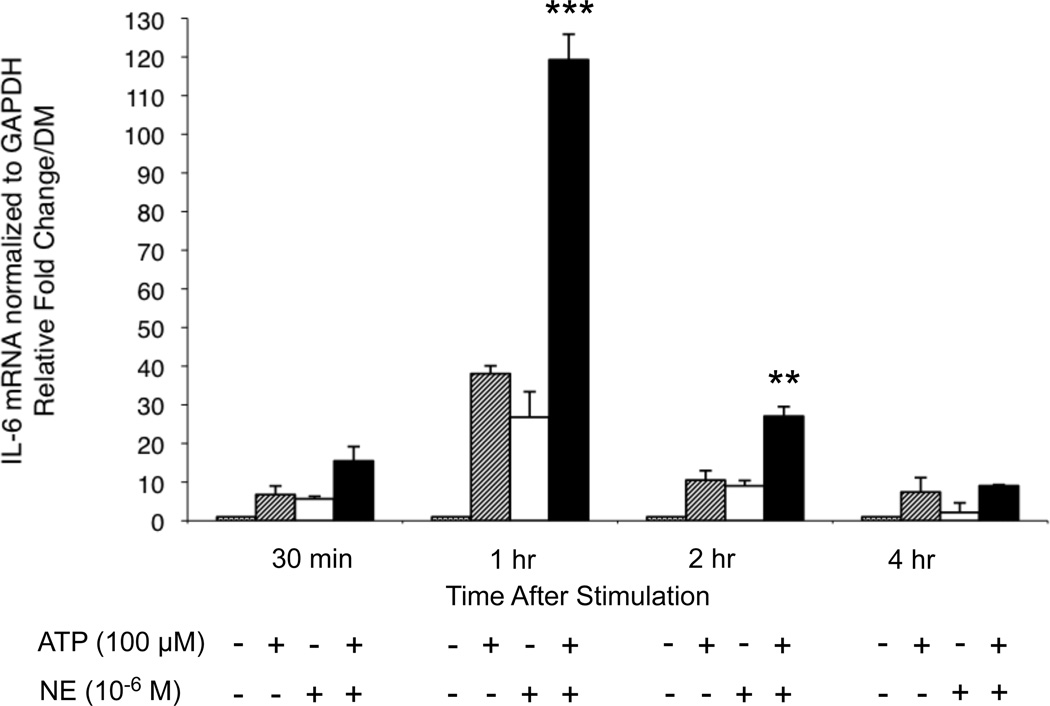
Figure 3.
Real-time PCR analysis of IL-6 mRNA levels. HMEC-1 cells were treated with 10−6 M NE and 100 µM ATP for the times indicated. Cells were lysed and total RNA was prepared. cDNA was synthesized from 1 µg RNA and qPCR was carried out using the Power SYBR green master mix and GAPDH as the internal control. mRNA levels were calculated using the relative comparative ΔΔCT method. 100 µM ATP induced IL-6 mRNA levels at 30 min (p<0.05),1 hr (p<0.001) and 2 hr (p<0.001) compared to DM. 10−6 M NE increased levels at 30 min (p<0.05), 1 hr (p<0.001) and 2 hr (p<0.01) versus DM. ATP and NE synergistically induce IL-6 mRNA at 1 hr (***p<0.001) and 2 hr (**p<0.01) versus additive effect of each agent alone. Results shown are the average of three independent experiments. Error bars represent the mean +/− SD.

