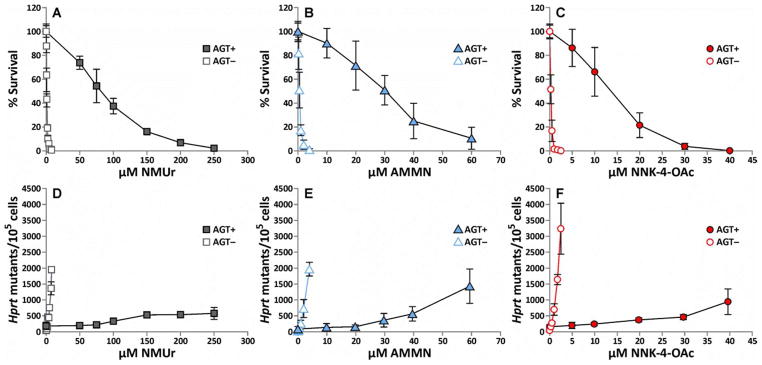
Figure 1.

Cytotoxicity (A–C) and hprt mutagenic activity (D–F) in CHOpcDNA3 (AGT−) and CHOAGT (AGT+) cell lines following a 1 h treatment with increasing concentrations of NMUr (A, D), AMMN (B, E) or NNK-4-OAc (C, F). The values represent the average of 3–4 separate experiments performed with duplicates or triplicates. The error bars represent the standard deviation. The lines were generated by connecting the data points. Data used to generate this figure are presented in Supplemental Data.
