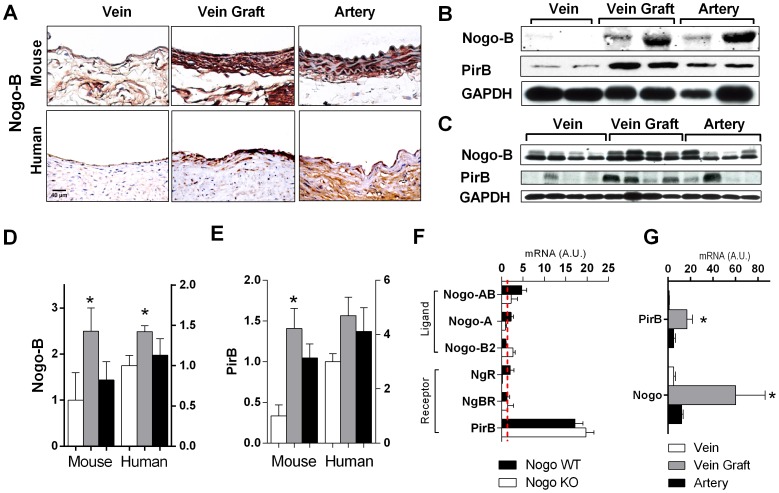
Figure 1. Increased Nogo-B and PirB expression in mouse and human vein grafts.
(A) Representative immunohistochemical staining images in mouse (top row) and human (bottom row) vein (left), vein graft (center), and aorta (right). n = 4. Scale bar, 40 µm. (B) Representative Western blot analysis showing Nogo-B and PirB up-regulation in individual mouse vein grafts; n = 2 matched specimens are shown of n = 4 samples. (C) Representative Western blot analysis showing Nogo-B and PirB up-regulation in individual human vein grafts; n = 4 unmatched specimens are shown. (D) Bar graph shows densitometry of Nogo-B bands shown in Panels (B) and (C) during mouse and human vein graft adaptation. *, p<0.05; t-test (vein vs. vein graft). (E) Bar graph shows densitometry of PirB bands shown in Panels (B) and (C) during mouse and human vein graft adaptation. *, p<0.05; t-test (vein vs. vein graft). (F) Bar graph shows summary of gene expression during mouse vein graft adaptation; the number of mRNA transcripts expressed during vein graft adaptation is compared to the number expressed in the wild type pre-implantation inferior vena cava (IVC), denoted by the red broken line. n = 4. ▪, Nogo WT; □, Nogo KO vein grafts. (G) Bar graph shows Nogo-B and PirB mRNA transcripts during human vein graft adaptation. Analysis of n = 8 veins, 6 vein grafts, and 5 arterial human specimens. *, p<0.05; t-test (vein vs. vein graft).

