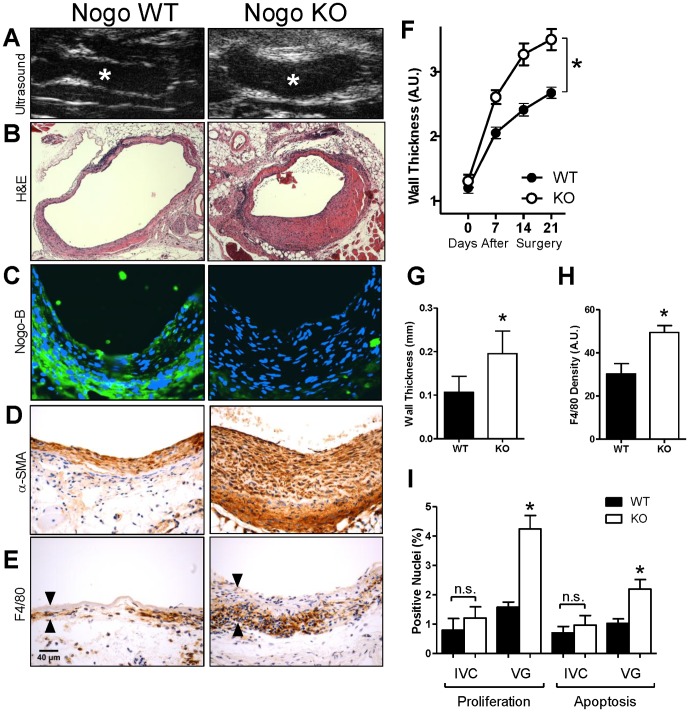
Figure 3. Nogo-B limits F4/80-positive cell infiltration during vein graft adaptation.
(A) Representative ultrasound images of mouse vein grafts. Nogo KO grafts (right panel) had significantly thicker graft walls compared to those of Nogo WT grafts (left panel). *, lumen. (B) Representative H&E image of WT and Nogo KO mouse vein grafts. Scale bar, 100 µm. (C) Representative immunofluorescence images of Nogo staining in WT and KO mouse vein grafts; no staining is present in Nogo KO vein grafts. Scale bar, 50 µm. (D) Representative image of smooth muscle alpha-actin (SMA) staining of Nogo WT and KO mouse vein grafts. (E) Representative images of Nogo WT and KO vein grafts with immunohistochemical staining for F4/80. Arrowheads show vein graft wall. n = 20, 25. (F) Line graph shows the time course of vein graft wall thickening as determined by ultrasound imaging. Nogo KO grafts had approximately 40 percent thicker walls compared to those of wild type grafts. *, p = 0.0041; ANOVA. (G) Bar graph shows summary of morphological analysis of wall thickness of Nogo WT and KO grafts. *, p = 0.0061; t-test; n = 5. (H) Bar graph shows summary of densitometry of F4/80 staining. *, p = 0.0011; t-test. n = 20, 25. (I) Bar graphs show summary of proliferation and apoptosis indices in mouse vein grafts. *, p<0.0001, ANOVA; post-hoc testing p<0.05; n = 8, 16, 8, 32 in each of the 4 groups, respectively.

