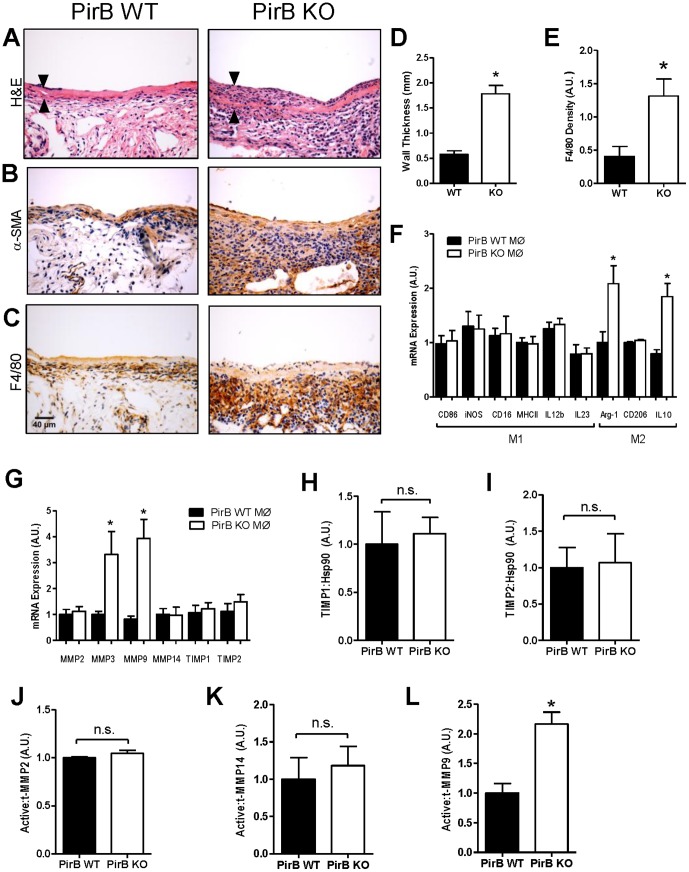
Figure 4. PirB limits F4/80-positive cell infiltration during vein graft adaptation.
(A) Representative H&E image of PirB WT and KO mouse vein grafts. Scale bar, 100 µm. Arrowheads show vein graft wall. n = 7. (B) Representative image of smooth muscle alpha-actin (SMA) staining of PirB WT and KO mouse vein grafts. n = 4. (C) Representative images of PirB WT and KO vein grafts with immunohistochemical staining for F4/80. n = 4. (D) Bar graph shows summary of morphological analysis of wall thickness of PirB WT and KO grafts. *, p<0.0001, t-test; n = 7. (E) Bar graph shows summary of densitometry of F4/80 staining. *, p = 0.0211, t-test; n = 4. (F) Bar graph shows summary of mRNA transcript expression in macrophages derived from PirB WT (▪) or PirB KO (□) mice. *, p<0.02, t-test. n = 6. (G) Bar graph shows summary of mRNA transcript expression in macrophages derived from PirB WT (▪) or PirB KO (□) mice. *, p<0.03, t-test. n = 6. (H) Bar graph shows mean densitometry of TIMP1 immunoreactivity in vein grafts derived from PirB WT (▪) or PirB KO (□) mice. n.s., not significant; p = 0.7859, t-test; n = 3. (I) Bar graph shows mean densitometry of TIMP2 immunoreactivity in vein grafts derived from PirB WT (▪) or PirB KO (□) mice. n.s., not significant; p = 0.8941, t-test; n = 3. (J) Bar graph shows mean densitometry of MMP2 activity in vein grafts derived from PirB WT (▪) or PirB KO (□) mice. n.s., not significant; p = 0.2252, t-test; n = 3. (K) Bar graph shows mean densitometry of MMP14 activity in vein grafts derived from PirB WT (▪) or PirB KO (□) mice. n.s., not significant; p = 0.6569, t-test; n = 4. (L) Bar graph shows mean densitometry of MMP9 activity in vein grafts derived from PirB WT (▪) or PirB KO (□) mice. *, p = 0.0109, t-test; n = 3.

