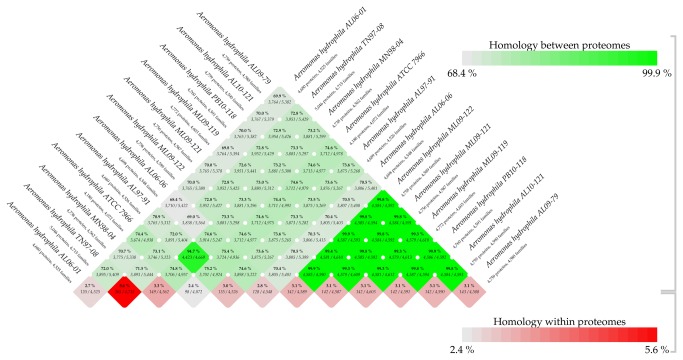
Figure 3. BLAST MATRIX of 12 different A. hydrophila isolates.
The proteomes of each of the A. hydrophila strains were compared using all-against-all BLASTp according to the methods described previously [29]. This matrix showed the output from pairwise comparison of conserved protein families of each of the isolates to each other. The green color represents the % homology between proteomes and the red color represents % homology within proteomes. This matrix showed that all the epidemic A. hydrophila isolates are similar to each other but substantially different to reference isolates. All of the reference isolates, except for MN98-04 and AL97-91 that were highly similar to each other, possessed substantial amount of diversity in their protein families.

