
Figure 1.
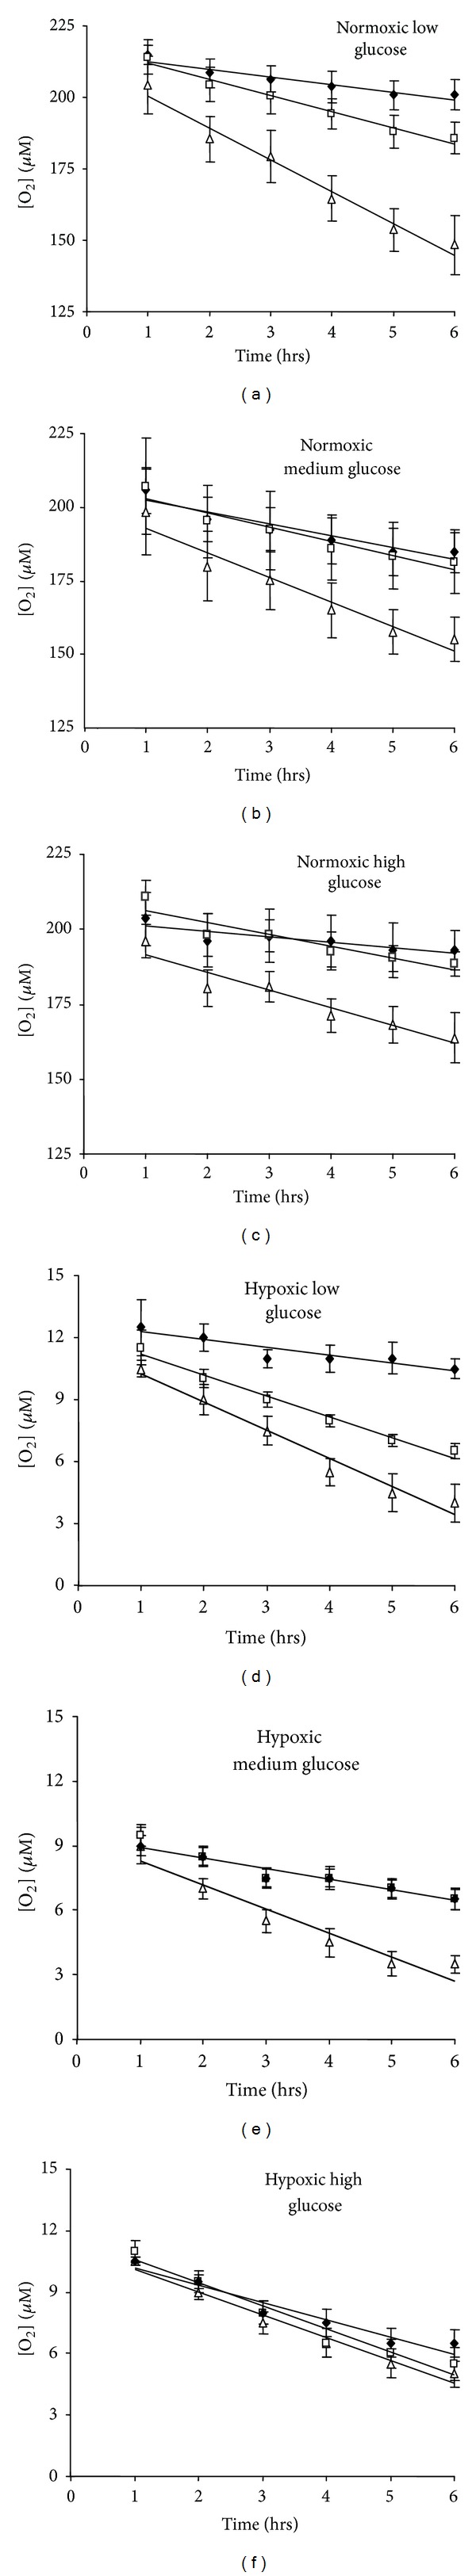
The depletion of oxygen within BD biosensor system containing C2C12 cells over a 6-hour culture period. The figures compare culture in low glucose (LG), medium glucose (MG), and high glucose (HG). The results are shown for 200 μL cell samples of 0.5 × 10⁵ cells/mL (♦), 1 × 10⁵ cells/mL (□), and 2 × 10⁵ cells/mL (Δ) cultured with the appropriate medium exposed in normoxic ((a)–(c)) and hypoxic ((d)–(f)) environments. Each point represents the mean and standard deviation of six replicates.