Figure 7.

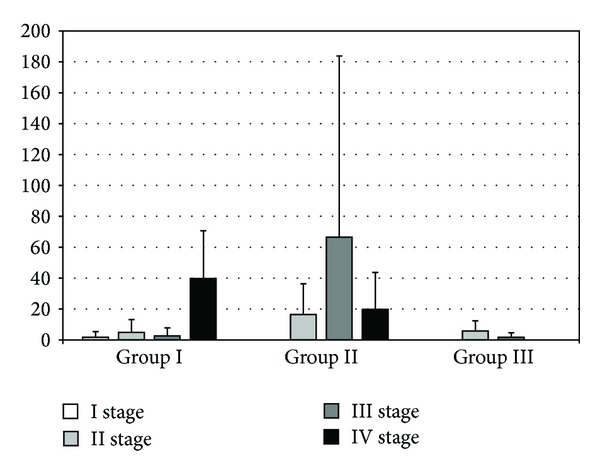
The levels of IL-6 in rat serum (pg/mL). The bars show mean ± SD. A difference in the levels of IL-6 between groups I and II during the stage III of the experiment was observed (2.57 ± 5.27 versus 66.49 ± 117.32; P = 0.01).

The levels of IL-6 in rat serum (pg/mL). The bars show mean ± SD. A difference in the levels of IL-6 between groups I and II during the stage III of the experiment was observed (2.57 ± 5.27 versus 66.49 ± 117.32; P = 0.01).