
Figure 8.
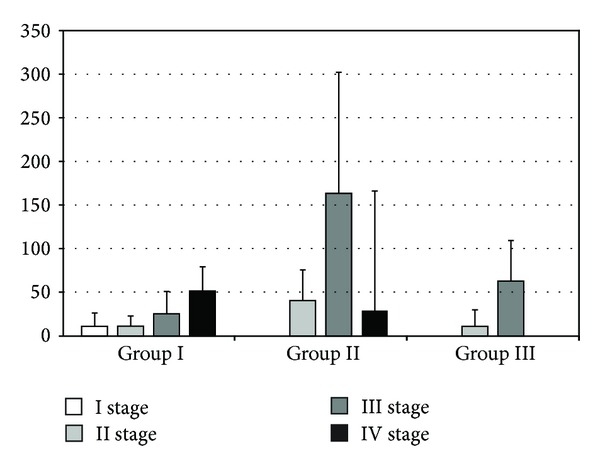
The levels of IL-10 in rat serum. The bars show mean ± SD (pg/mL). A statistical significance was observed in group II between stages II and III (40.58 ± 35.38 versus 163.55 ± 139.06; P < 0.01) and between stages III and IV (163.55 ± 139.06 versus 29.09 ± 33.06; P < 0.01) of the experiment. Furthermore, a significant increase was observed in group III between stages II and III of the experiment (11.12 ± 18.93 versus 62.99 ± 46.53; P = 0.01). A statistically significant difference was observed in stage II of the experiment between groups I and II (11.27 ± 11.84 versus 40.58 ± 35.38; P = 0.02) and between groups II and III (40.58 ± 35.38 versus 11.12 ± 18.93; P = 0.01). In the third stage of the experiment, a difference between groups I and II was observed (25.37 ± 25.889 versus 163.55 ± 139.06; P = 0.00002).