
Figure 9.
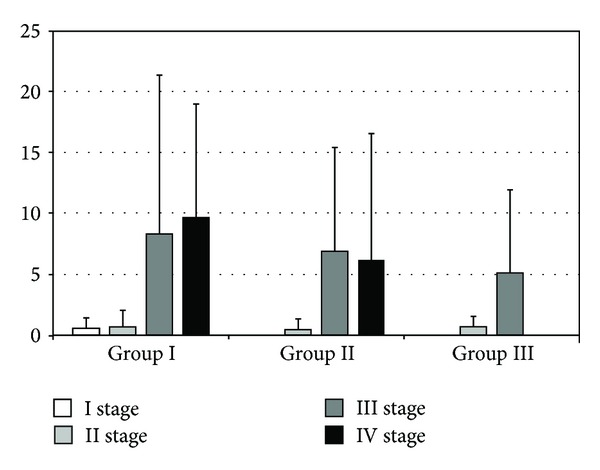
The levels of IFN-γ in rat serum. The bars show mean ± SD (pg/mL). A statistically significant increase in the concentration of cytokines was observed in group II between stages II and III of the experiment (0.44 ± 0.90 versus 6.87 ± 8.55; P < 0.01) and stages II and IV (0.44 ± 0.90 versus 6.16 ± 10.38; P < 0.01). Other visible differences did not reach statistical significance.