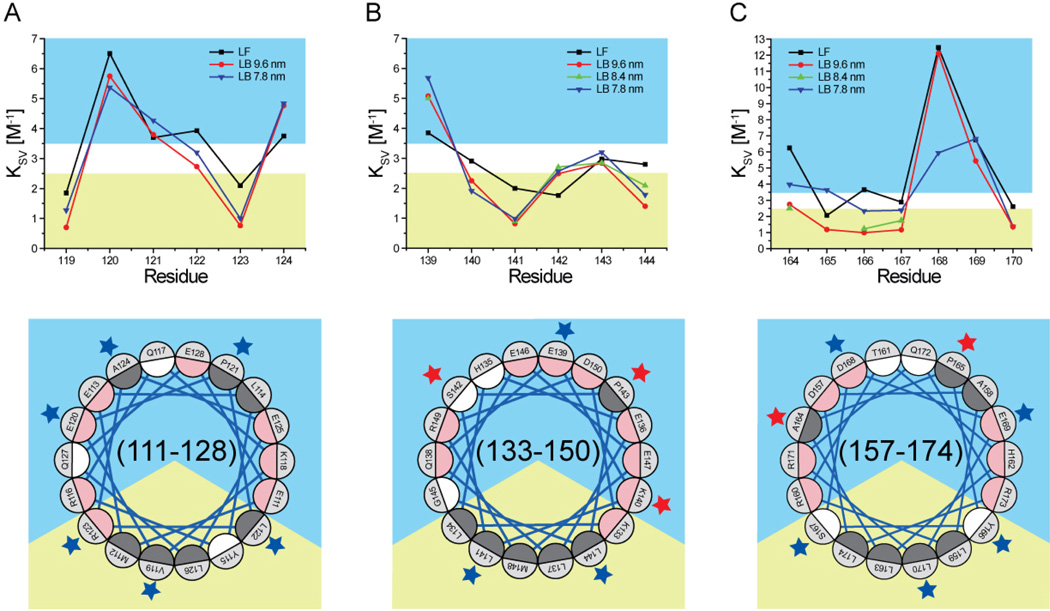
Fig. 3.
Stern-Volmer constant (Ksv) of residues 119–124 (panel A), 139–144 (panel B), and 164–170 (panel C). Bottom quadrants are Schiffer-Edmunson helical wheel diagrams of regions 111–128, 133–150, and 157–174 oriented and color-coded as explained in legend to Fig. 2. Residues 119–124, 139–144, and 164–170 are marked by blue or red stars if their Ksv is or is not consistent with a lipid-associated amphipathic α-helix conformation, respectively.

