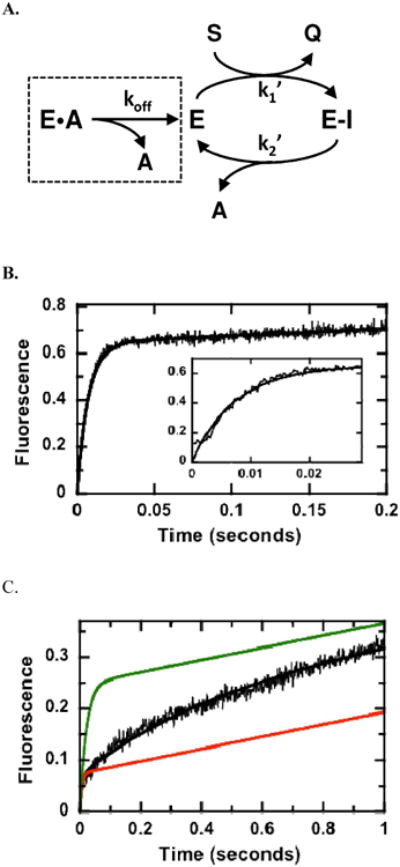
Figure 5.

Catalytic Trapping of AMP.(A) Kinetic mechanism. Data in the absence and presence of AMP are simulated using the program DynaFit and a two-step acylation/deacylation mechanism. (B) Kinetic transient in the absence of AMP. Hint1 (5 μM) is mixed with TpAd (20μM) in the stopped flow instrument and the fluorescence changes are simulated using the kinetic scheme in panel A where k1′ and k2′ are 7.2 μM−1s−1 and 0.5 s−1 and the output for Q is 0.26 volts/mM. (C) Kinetic transient in the presence of 2500 mM AMP. Conditions are the same as in panel B except 2500 mM AMP is preequilbrated with the enzyme prior to mixing. The fluorescence changes are simulated using fixed values for k1 ′ and k2′ from panel B, 0.7 and 1.8 mM E and E•A, an output for Q of 0.1 volts/mM and a koff of 2.7 s−1 (black line). The data were also simulated using koff values of 50 (green line) and 0.5 s−1 (red line).
