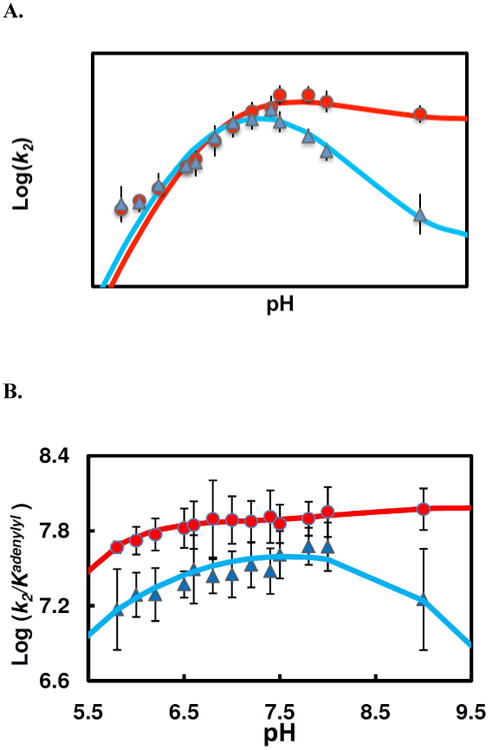
Figure 6.

pH dependence of pre-steady state kinetic parameters of the enzyme adenylylation by TpAd (▲) and AIPA(●). (A) Plots of adenylylation rate (k2) vs. pH. The data fitting (Scheme 2, eq 12) for AIPA reaction (red line) yields following values of the characterizing parameters: pK1= 6.68 ± 0.09, pK2= 8.03 ± 0.16, r= 0.72 ± 0.11, (k2)lim= 673±50 s−1; for TpAd reaction (blue line), pK1= 6.56 ± 0.13, pK2= 7.90 ± 0.24, r= 0.16 ± 0.08, (k2)lim= 634 ± 86 s−1. (B) Plots of k2/Kadenylyl vs. pH. The pH profiles for AIPA reaction (red line) and for TpAd (blue line) were relatively flat, indicating substrates are sticky.
