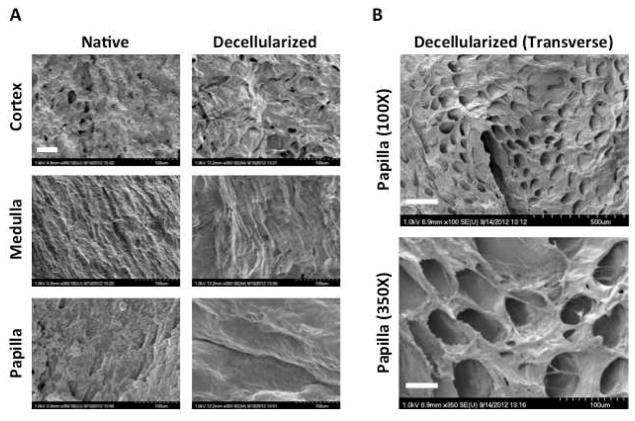
Figure 3. Ultrastructure of native and decellularized kidney regions.
A Scanning electron microscopy at 350X reveals differences in ECM topography between kidney regions before and after decellularization. Scale bar: 50μm. B Transverse sections of decellularized papilla at 100X and 350X indicate that tubular ultrastructure is preserved in the KSC niche after decellularization. Scale bars: 250μm (top) and 50μm (bottom).

