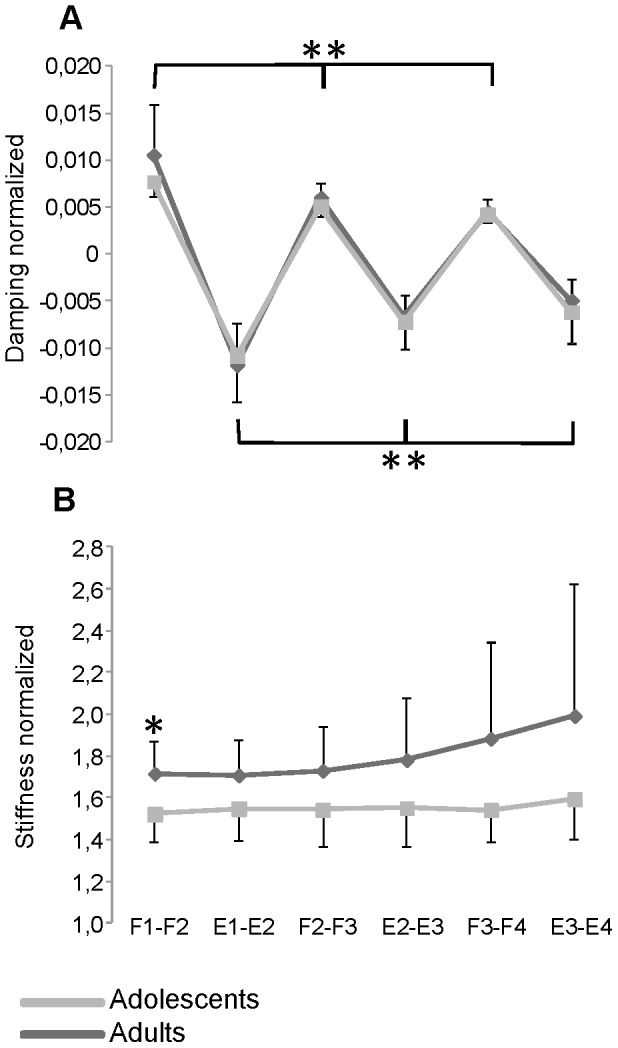
Figure 4. Damping and stiffness coefficients variations.

Damping (A) and stiffness (B) coefficients estimated for adolescents (grey line) and adults (black line) with Down syndrome over the three cycles following the first flexion. F1–F4, peak angles of flexion; E1–E4, peak angles of extension. Data were normalized to the gravitational torque and expressed as means and standard deviations.* P<0.05. ** P<0.01.
