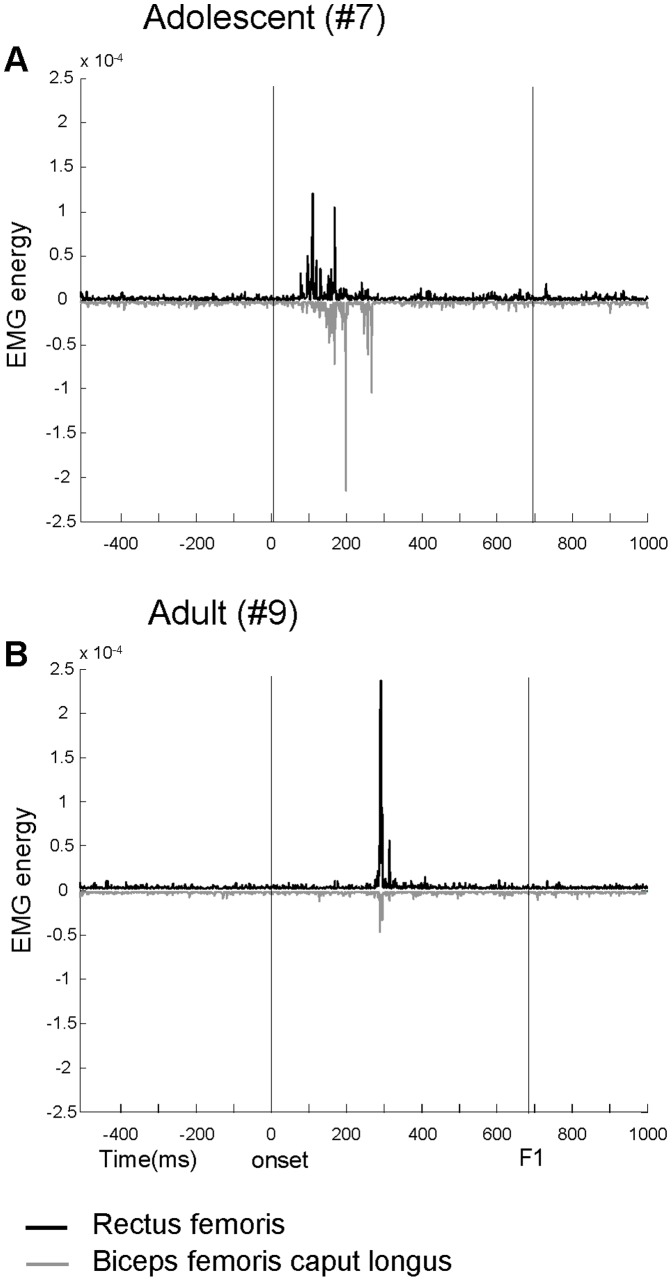
Figure 5. Examples of agonist-antagonist co-activation.
Agonist-antagonist co-activation of Rectus femoris (black traces) and Biceps femoris (gray traces) recorded in one adolescent (A) and one adult (B) with Down syndrome. Vertical lines delimit the interval between the onset of the leg fall and the time of reversal at the end of the first flexion (F1). The traces represent the EMG with TKEO signal condition.

