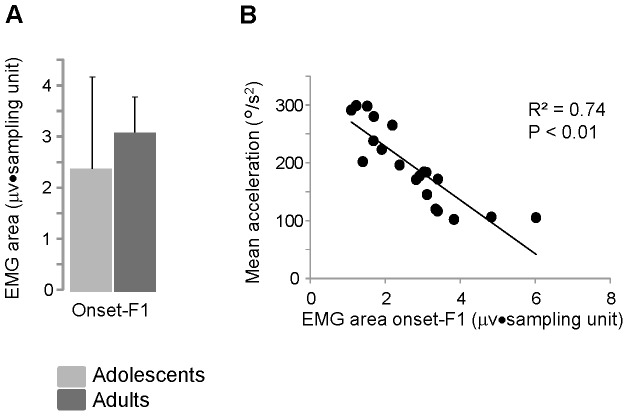
Figure 7. Quantification of the Rectus femoris activity and its relationship with movement acceleration.
(A) Mean values and standard deviations of the total area of the Rectus femoris EMG activity recorded over the first flexion (from the onset of the leg fall to the first flexion peak, F1). (B) Relationship between changes of mean acceleration and EMG area during the first flexion. Each data point represents the average value obtained from 10 trials executing by each participant.

