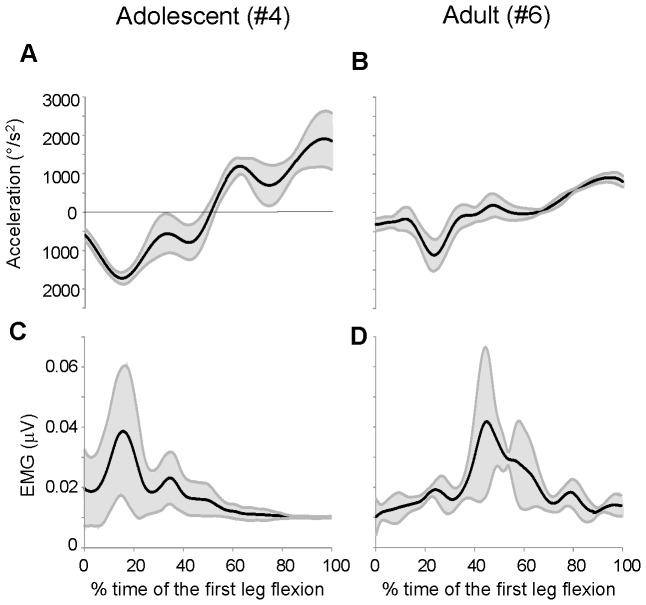
Figure 8. Examples of variability of kinematic and EMG traces.
Averaged acceleration (A–B) and EMG (C–D) traces for one adolescent and one adult with Down syndrome over the interval of the first flexion. Each data point reports the mean value (black lines) and ±1 standard deviation (grey lines) computed from 10 trials. The time base is expressed as fraction of the first flexion length.

