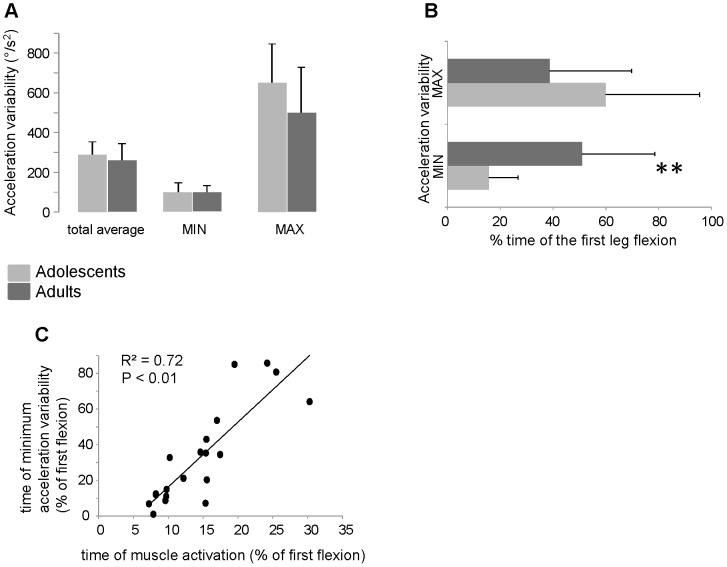
Figure 9. Analysis of kinematics variability and its relationship with muscle activation.
(A) Means and standard deviations of the amount of acceleration variability. For each subject, the variability was estimated as the mean value from the standard deviations of all data point over the first flexion (total average) and from the standard deviations of the 10 trials at the time of the minimum (MIN) and maximum (MAX) variability. (B) Means and standard deviations of the timing of occurrence of the minimum and maximum variability expressed as fraction of the first flexion length. (C) Linear regression between the time of muscle activation and the time of minimum acceleration variability computed by the data from each subject (black circles). The axes values are fractions of the first flexion length. ** P<0.01.

