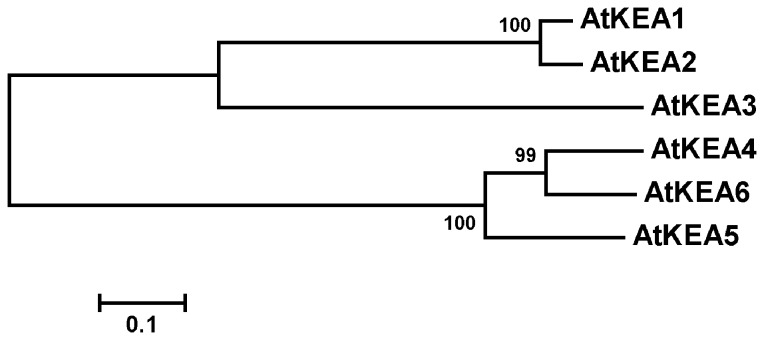
Figure 2. Cladogram analysis of the AtKEA family.
Cladogram analysis was conducted using MEGA 5.02. The alignment was based on the predicted amino acid sequences of AtKEA1, AtKEA2, AtKEA3, AtKEA4, AtKEA5 and AtKEA6. Evolutionary distances were computed by the Neighbor Joining method. The scale bar indicates the distance calculated from the multiple alignments.

