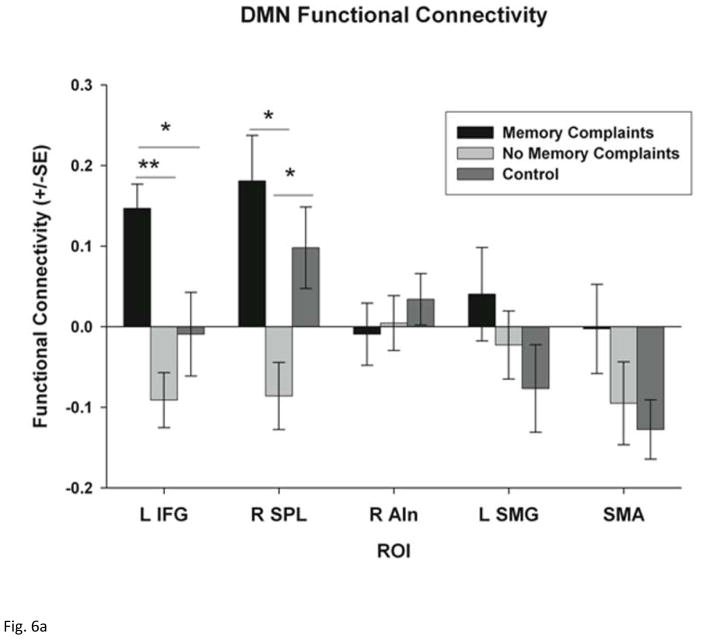
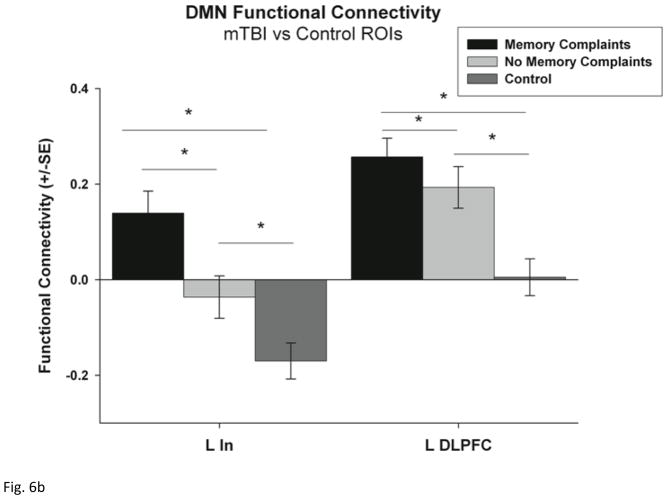
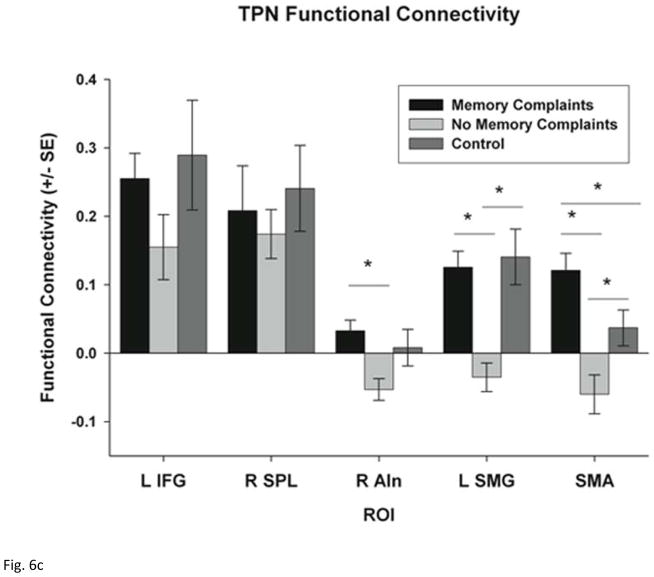
Figure 6.
ROI analysis of functional connectivity within each network. (a) functional connectivity between the DMN (PCC seed) and the five selected ROIs including the left inferior frontal gyrus (L IFG), right superior parietal lobe (R SPL), right anterior insula (R AIn), left supramarginal gyrus (L SMG) and the supplementary motor area (SMA). (b) functional connectivity between the DMN (PCC seed) and the left Insula (L In) and the left dorsolateral prefrontal cortex (LDLFPC) (c) functional connectivity between the TPN (bilateral DLPFC seed) and the same five ROIs. Group differences were tested using Student’s t-tests and corrected for multiple comparisons using Bonferroni correction. * p < 0.05 and ** p < 0.001.


